>>> """
============
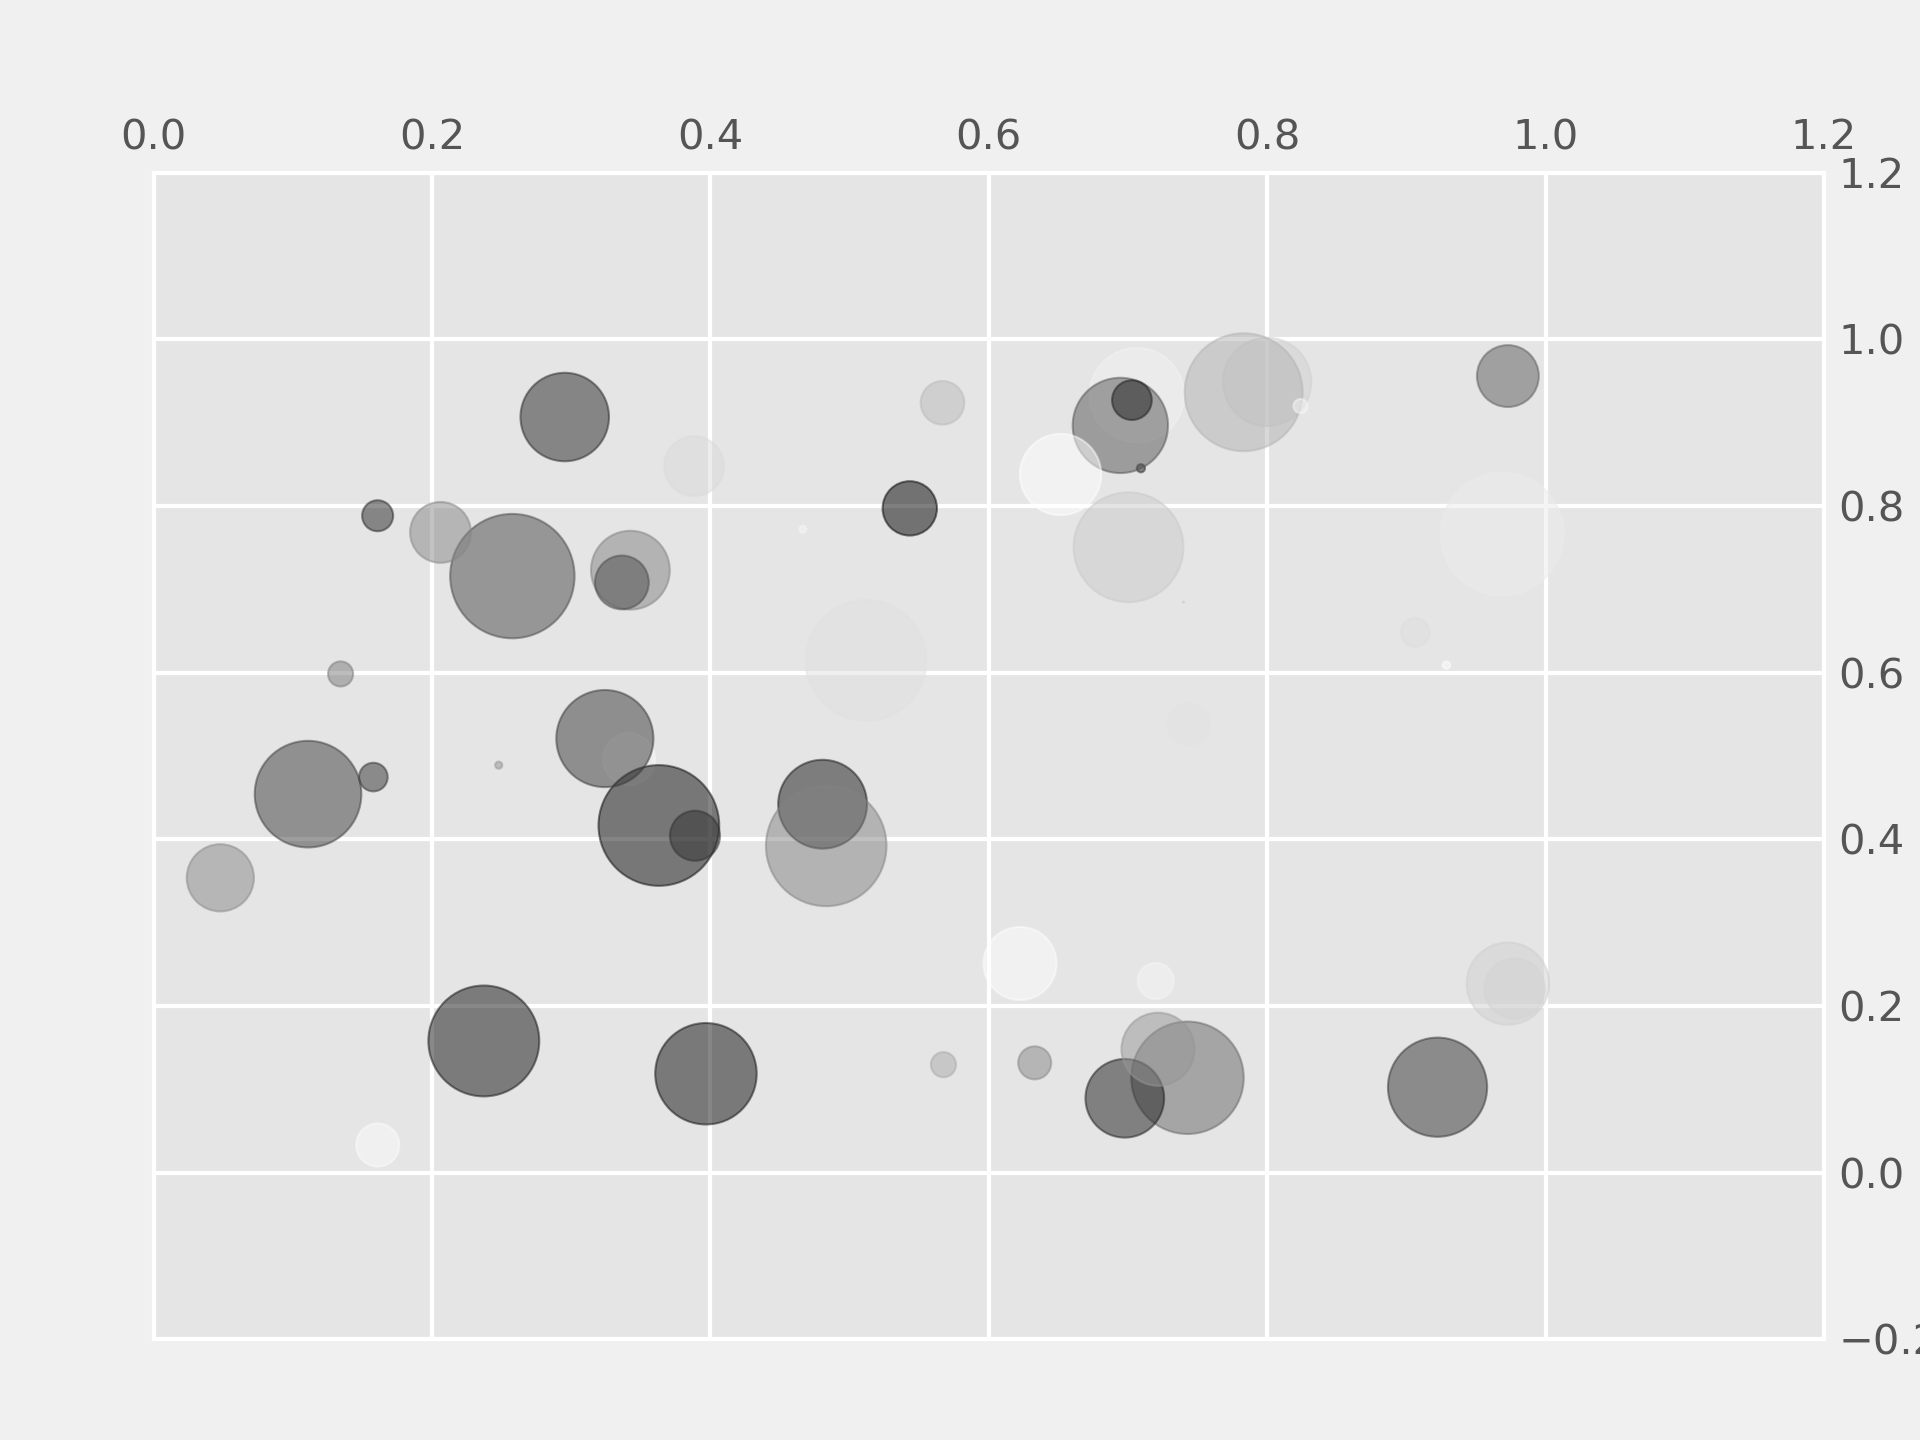
Scatter plot
============
This example showcases a simple scatter plot.
"""
... import numpy as np
... import matplotlib.pyplot as plt
...
... # Fixing random state for reproducibility
... np.random.seed(19680801)
...
...
... N = 50
... x = np.random.rand(N)
... y = np.random.rand(N)
... colors = np.random.rand(N)
... area = (30 * np.random.rand(N))**2 # 0 to 15 point radii
...
... plt.scatter(x, y, s=area, c=colors, alpha=0.5)
... plt.show()
...
... #############################################################################
... #
... # .. admonition:: References
... #
... # The use of the following functions, methods, classes and modules is shown
... # in this example:
... #
... # - `matplotlib.axes.Axes.scatter` / `matplotlib.pyplot.scatter`
...