>>> """
==========================
The default tick formatter
==========================
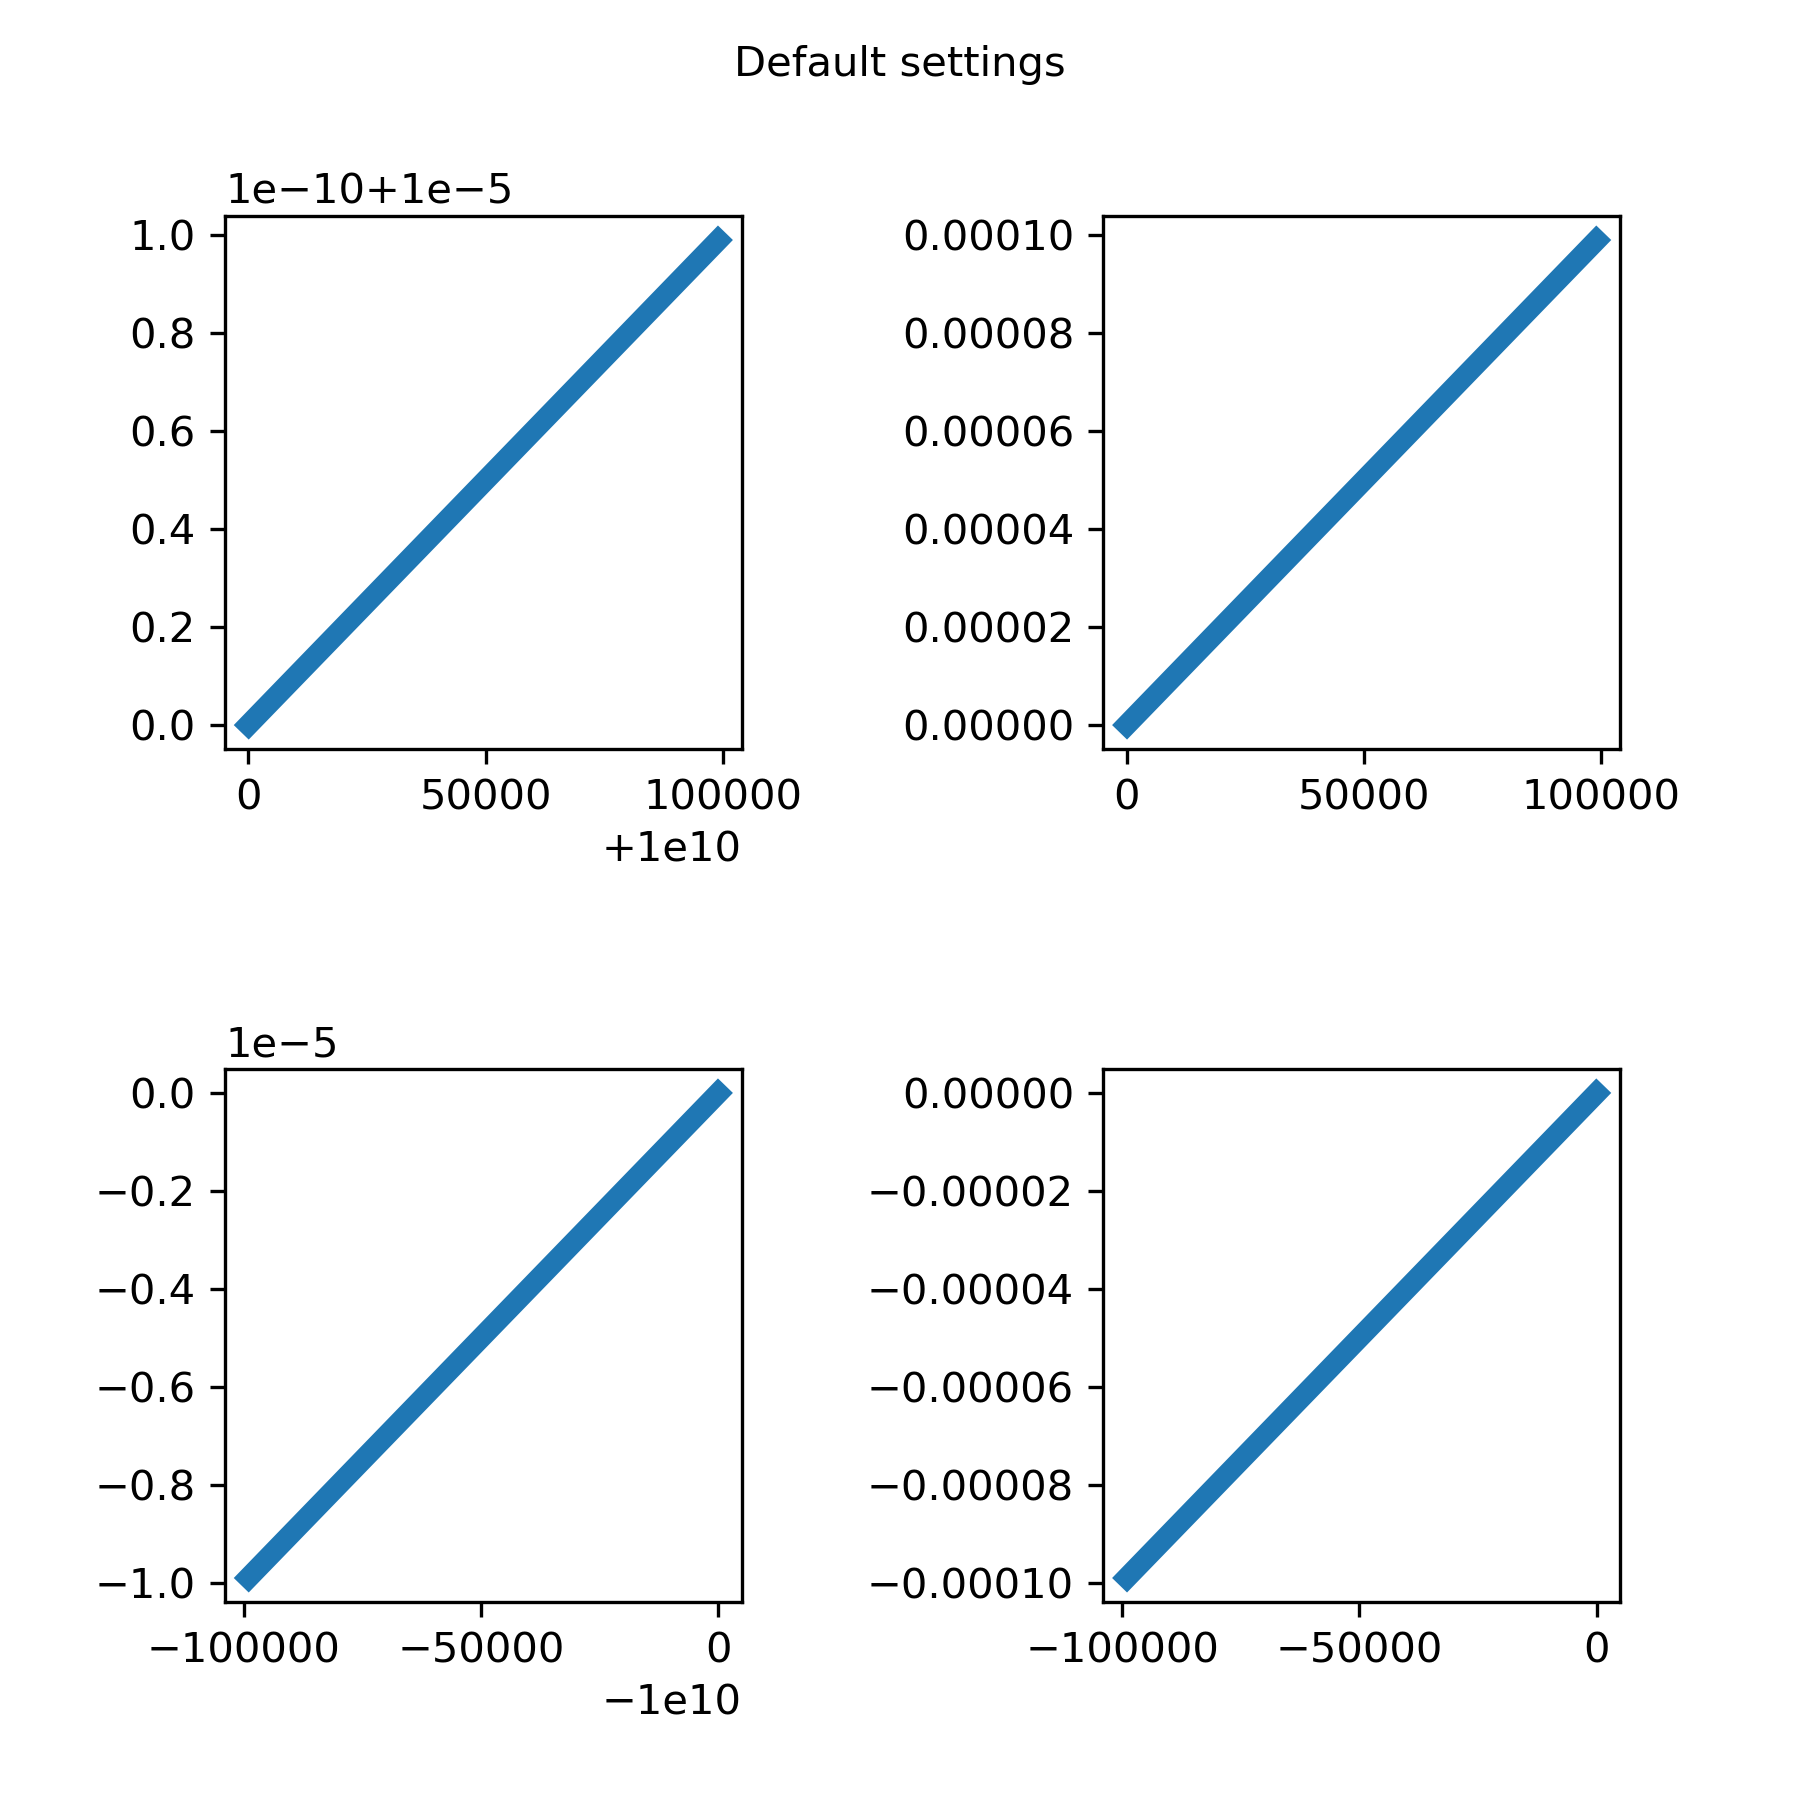
The example shows use of the default `.ScalarFormatter` with different
settings.
Example 1 : Default
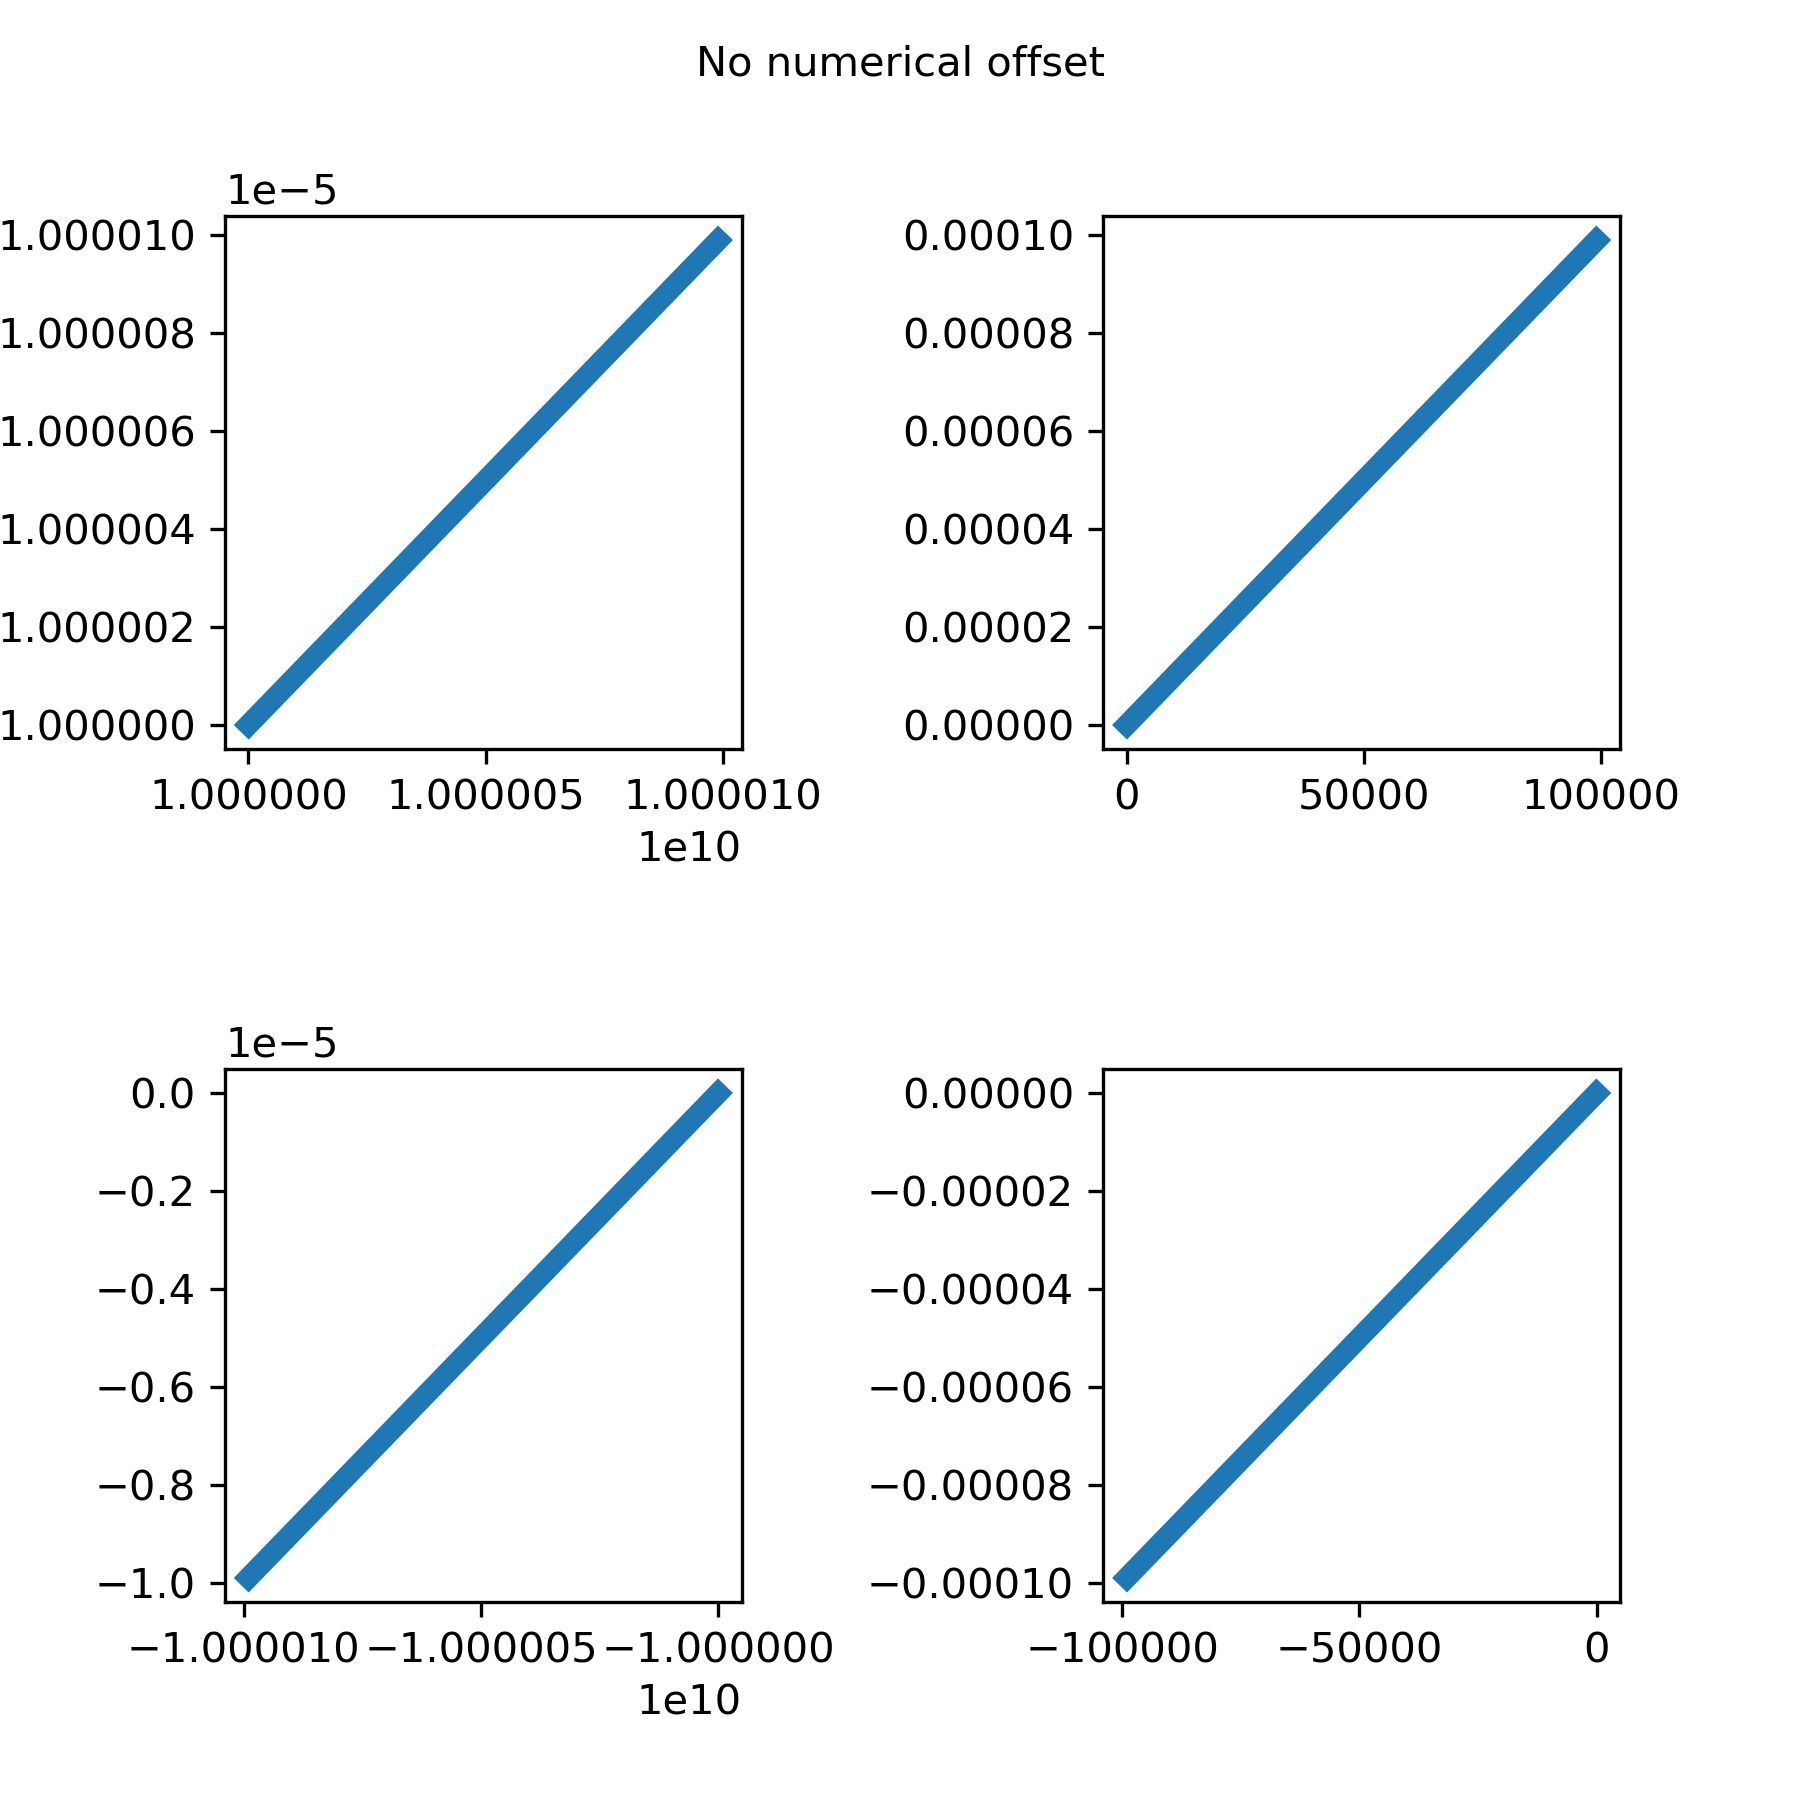
Example 2 : With no Numerical Offset
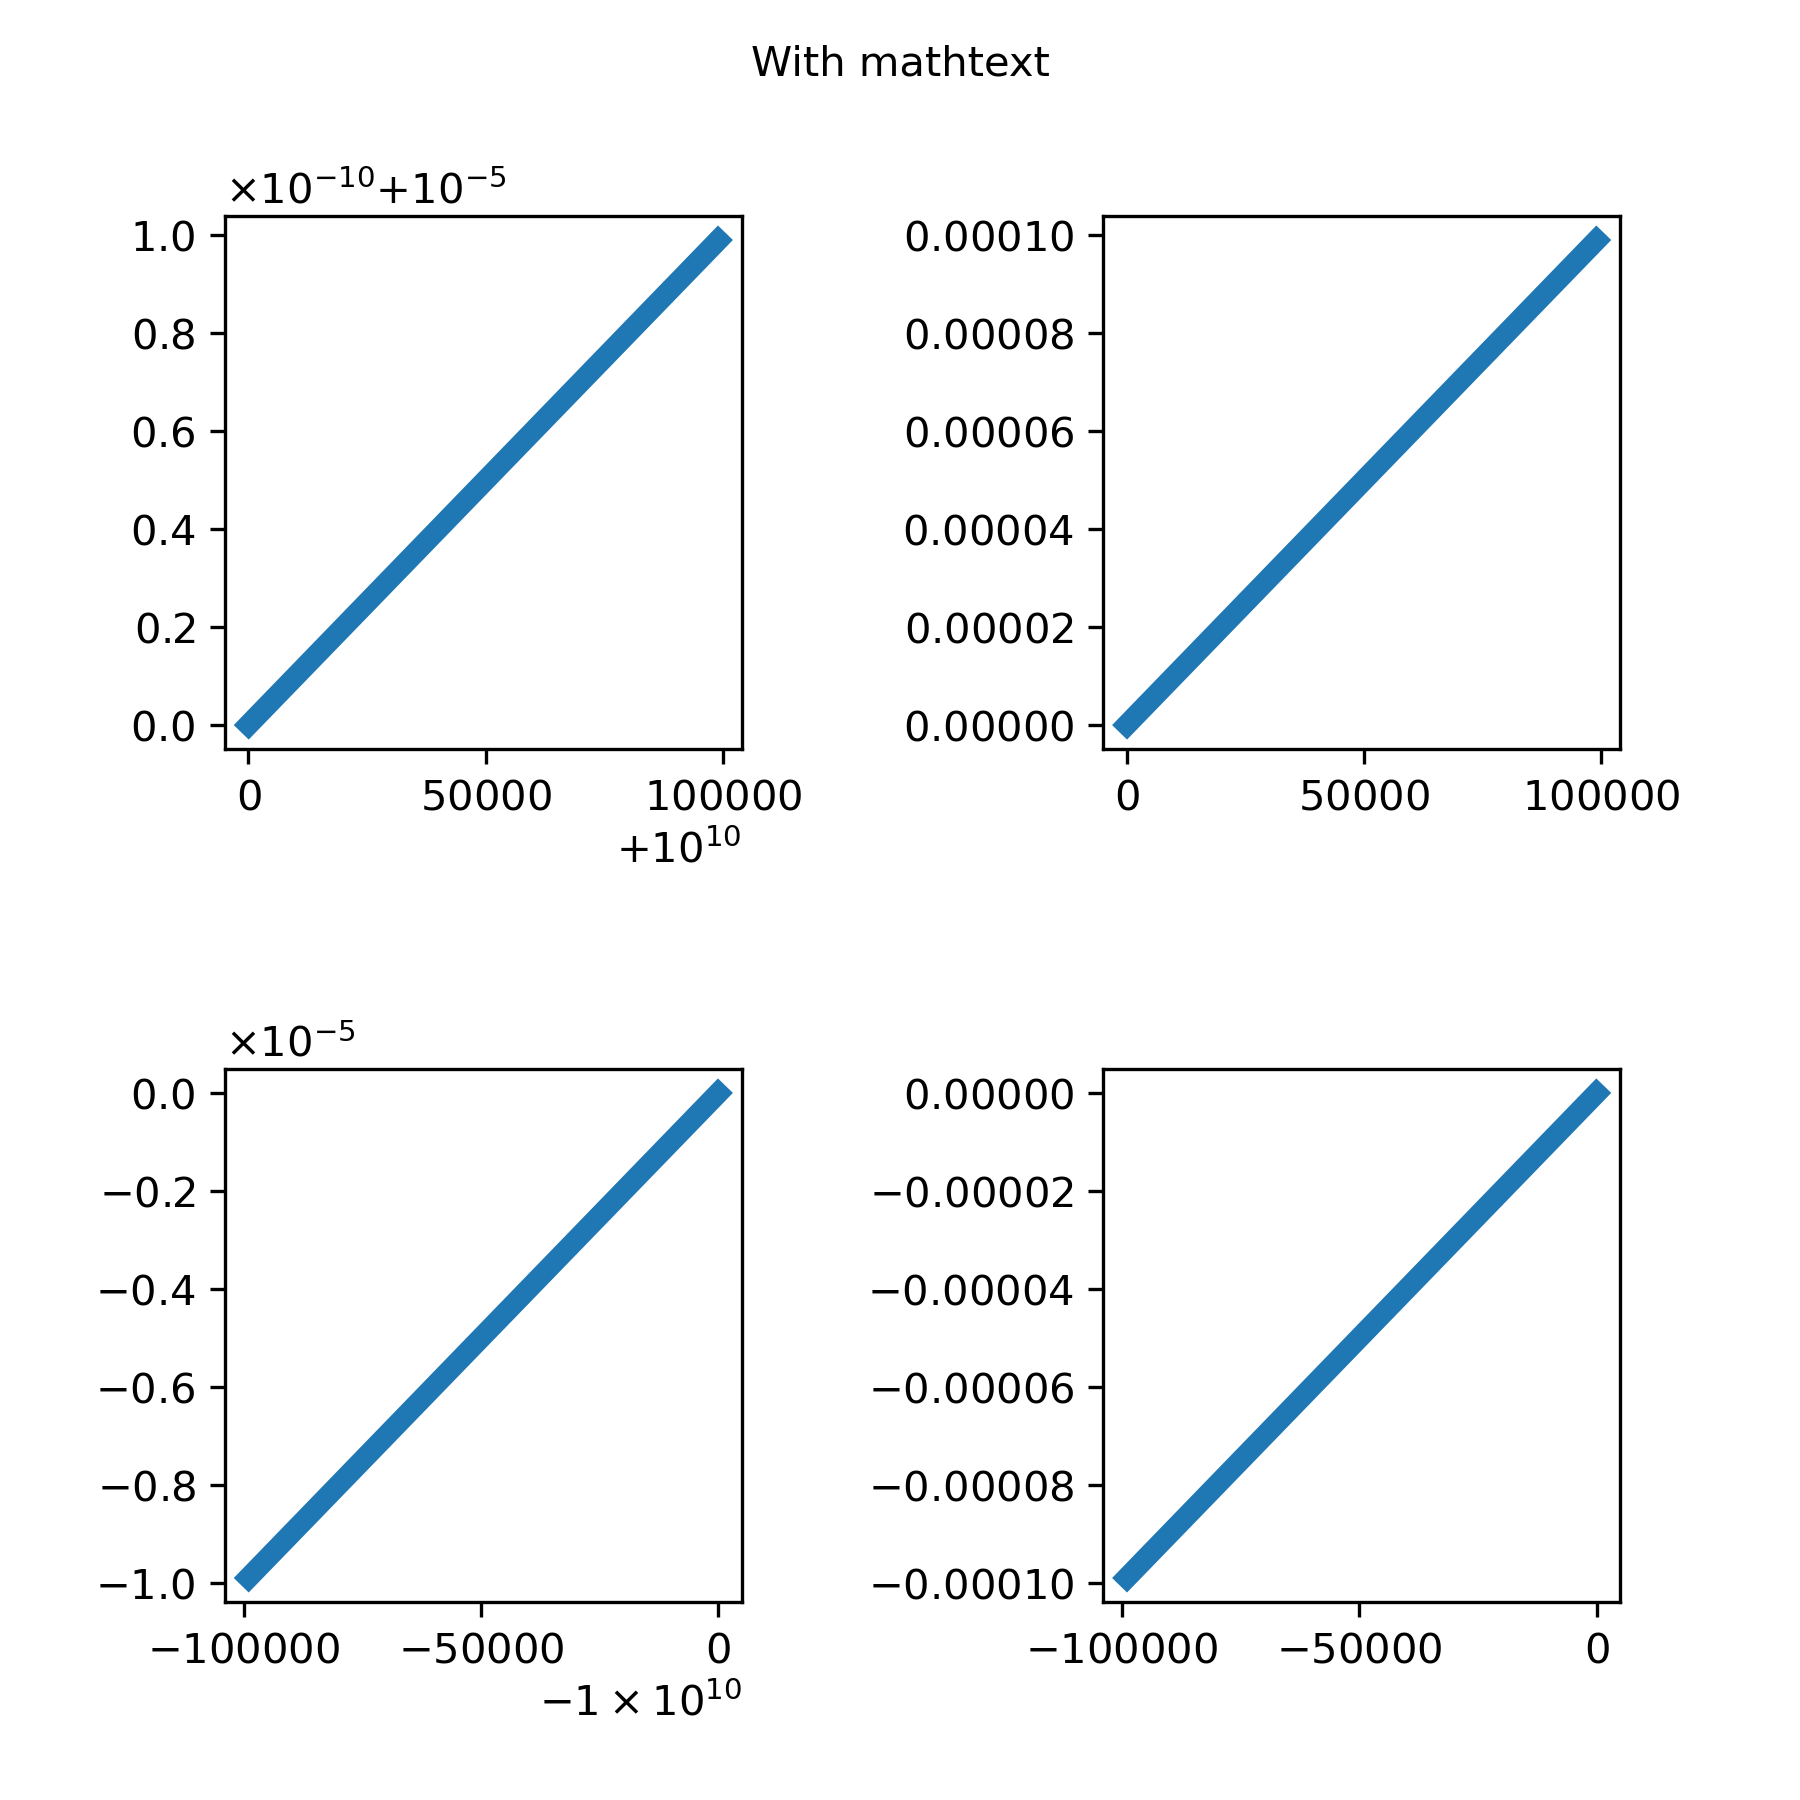
Example 3 : With Mathtext
"""
...
... import matplotlib.pyplot as plt
... import numpy as np
...
... ###############################################################################
... # Example 1
...
... x = np.arange(0, 1, .01)
... fig, [[ax1, ax2], [ax3, ax4]] = plt.subplots(2, 2, figsize=(6, 6))
... fig.text(0.5, 0.975, 'Default settings',
... horizontalalignment='center',
... verticalalignment='top')
...
... ax1.plot(x * 1e5 + 1e10, x * 1e-10 + 1e-5)
...
... ax2.plot(x * 1e5, x * 1e-4)
...
... ax3.plot(-x * 1e5 - 1e10, -x * 1e-5 - 1e-10)
...
... ax4.plot(-x * 1e5, -x * 1e-4)
...
... fig.subplots_adjust(wspace=0.7, hspace=0.6)
...
... ###############################################################################
... # Example 2
...
... x = np.arange(0, 1, .01)
... fig, [[ax1, ax2], [ax3, ax4]] = plt.subplots(2, 2, figsize=(6, 6))
... fig.text(0.5, 0.975, 'No numerical offset',
... horizontalalignment='center',
... verticalalignment='top')
...
... ax1.plot(x * 1e5 + 1e10, x * 1e-10 + 1e-5)
... ax1.ticklabel_format(useOffset=False)
...
... ax2.plot(x * 1e5, x * 1e-4)
... ax2.ticklabel_format(useOffset=False)
...
... ax3.plot(-x * 1e5 - 1e10, -x * 1e-5 - 1e-10)
... ax3.ticklabel_format(useOffset=False)
...
... ax4.plot(-x * 1e5, -x * 1e-4)
... ax4.ticklabel_format(useOffset=False)
...
... fig.subplots_adjust(wspace=0.7, hspace=0.6)
...
... ###############################################################################
... # Example 3
...
... x = np.arange(0, 1, .01)
... fig, [[ax1, ax2], [ax3, ax4]] = plt.subplots(2, 2, figsize=(6, 6))
... fig.text(0.5, 0.975, 'With mathtext',
... horizontalalignment='center',
... verticalalignment='top')
...
... ax1.plot(x * 1e5 + 1e10, x * 1e-10 + 1e-5)
... ax1.ticklabel_format(useMathText=True)
...
... ax2.plot(x * 1e5, x * 1e-4)
... ax2.ticklabel_format(useMathText=True)
...
... ax3.plot(-x * 1e5 - 1e10, -x * 1e-5 - 1e-10)
... ax3.ticklabel_format(useMathText=True)
...
... ax4.plot(-x * 1e5, -x * 1e-4)
... ax4.ticklabel_format(useMathText=True)
...
... fig.subplots_adjust(wspace=0.7, hspace=0.6)
...
... plt.show()
...