>>> """
===============
Resampling Data
===============
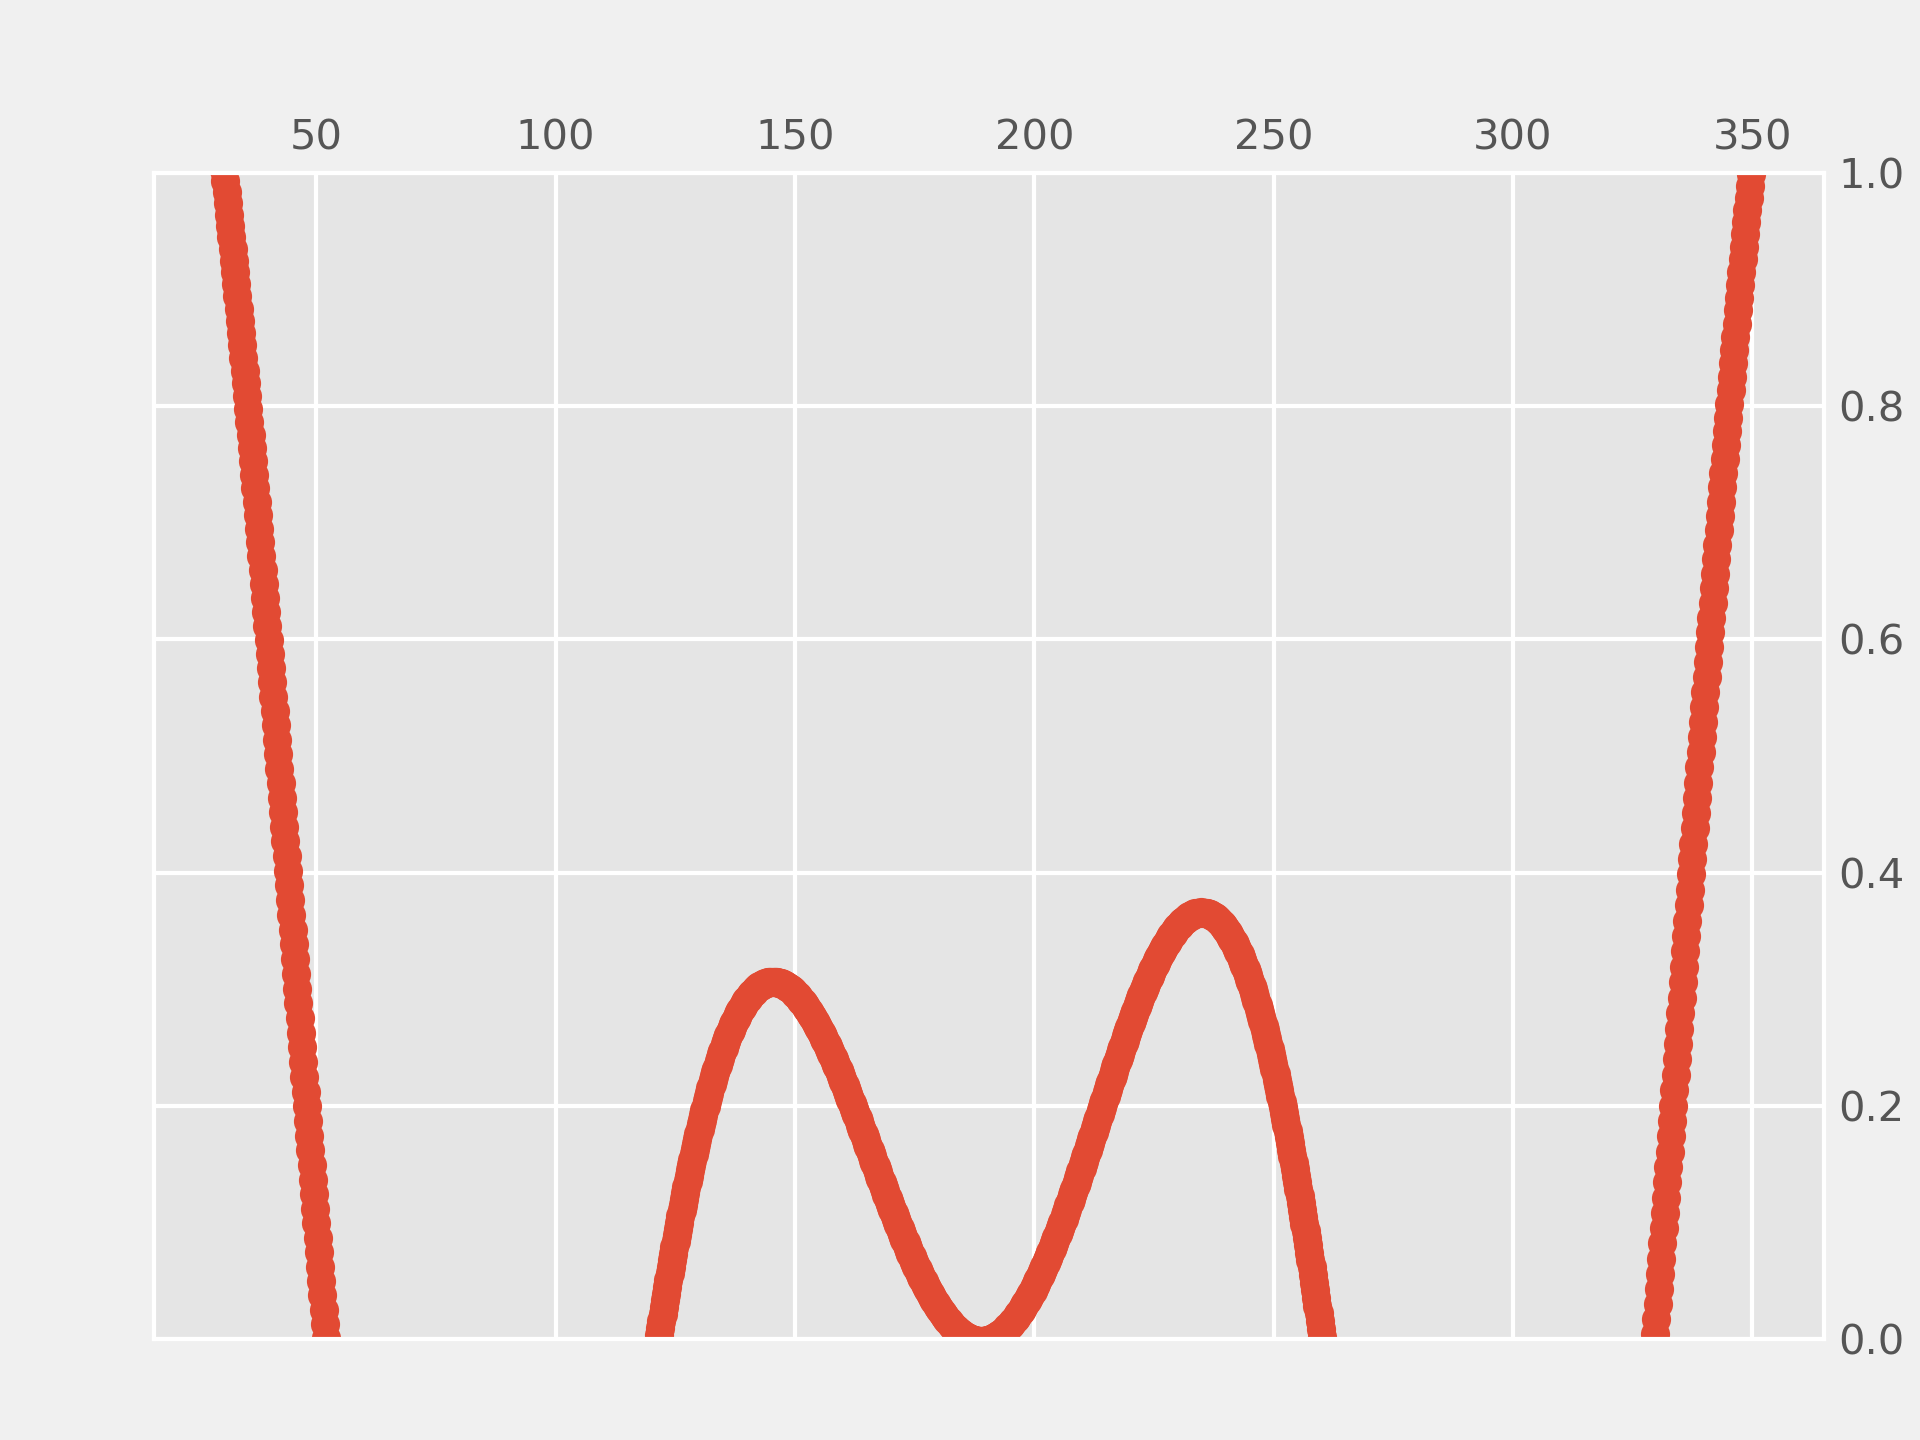
Downsampling lowers the sample rate or sample size of a signal. In
this tutorial, the signal is downsampled when the plot is adjusted
through dragging and zooming.
"""
...
... import numpy as np
... import matplotlib.pyplot as plt
...
...
... # A class that will downsample the data and recompute when zoomed.
... class DataDisplayDownsampler:
... def __init__(self, xdata, ydata):
... self.origYData = ydata
... self.origXData = xdata
... self.max_points = 50
... self.delta = xdata[-1] - xdata[0]
...
... def downsample(self, xstart, xend):
... # get the points in the view range
... mask = (self.origXData > xstart) & (self.origXData < xend)
... # dilate the mask by one to catch the points just outside
... # of the view range to not truncate the line
... mask = np.convolve([1, 1, 1], mask, mode='same').astype(bool)
... # sort out how many points to drop
... ratio = max(np.sum(mask) // self.max_points, 1)
...
... # mask data
... xdata = self.origXData[mask]
... ydata = self.origYData[mask]
...
... # downsample data
... xdata = xdata[::ratio]
... ydata = ydata[::ratio]
...
... print("using {} of {} visible points".format(len(ydata), np.sum(mask)))
...
... return xdata, ydata
...
... def update(self, ax):
... # Update the line
... lims = ax.viewLim
... if abs(lims.width - self.delta) > 1e-8:
... self.delta = lims.width
... xstart, xend = lims.intervalx
... self.line.set_data(*self.downsample(xstart, xend))
... ax.figure.canvas.draw_idle()
...
...
... # Create a signal
... xdata = np.linspace(16, 365, (365-16)*4)
... ydata = np.sin(2*np.pi*xdata/153) + np.cos(2*np.pi*xdata/127)
...
... d = DataDisplayDownsampler(xdata, ydata)
...
... fig, ax = plt.subplots()
...
... # Hook up the line
... d.line, = ax.plot(xdata, ydata, 'o-')
... ax.set_autoscale_on(False) # Otherwise, infinite loop
...
... # Connect for changing the view limits
... ax.callbacks.connect('xlim_changed', d.update)
... ax.set_xlim(16, 365)
... plt.show()
...