>>> """
=================================
Rasterization for vector graphics
=================================
Rasterization converts vector graphics into a raster image (pixels). It can
speed up rendering and produce smaller files for large data sets, but comes
at the cost of a fixed resolution.
Whether rasterization should be used can be specified per artist. This can be
useful to reduce the file size of large artists, while maintaining the
advantages of vector graphics for other artists such as the axes
and text. For instance a complicated `~.Axes.pcolormesh` or
`~.Axes.contourf` can be made significantly simpler by rasterizing.
Setting rasterization only affects vector backends such as PDF, SVG, or PS.
Rasterization is disabled by default. There are two ways to enable it, which
can also be combined:
- Set `~.Artist.set_rasterized` on individual artists, or use the keyword
argument *rasterized* when creating the artist.
- Set `.Axes.set_rasterization_zorder` to rasterize all artists with a zorder
less than the given value.
The storage size and the resolution of the rasterized artist is determined by
its physical size and the value of the ``dpi`` parameter passed to
`~.Figure.savefig`.
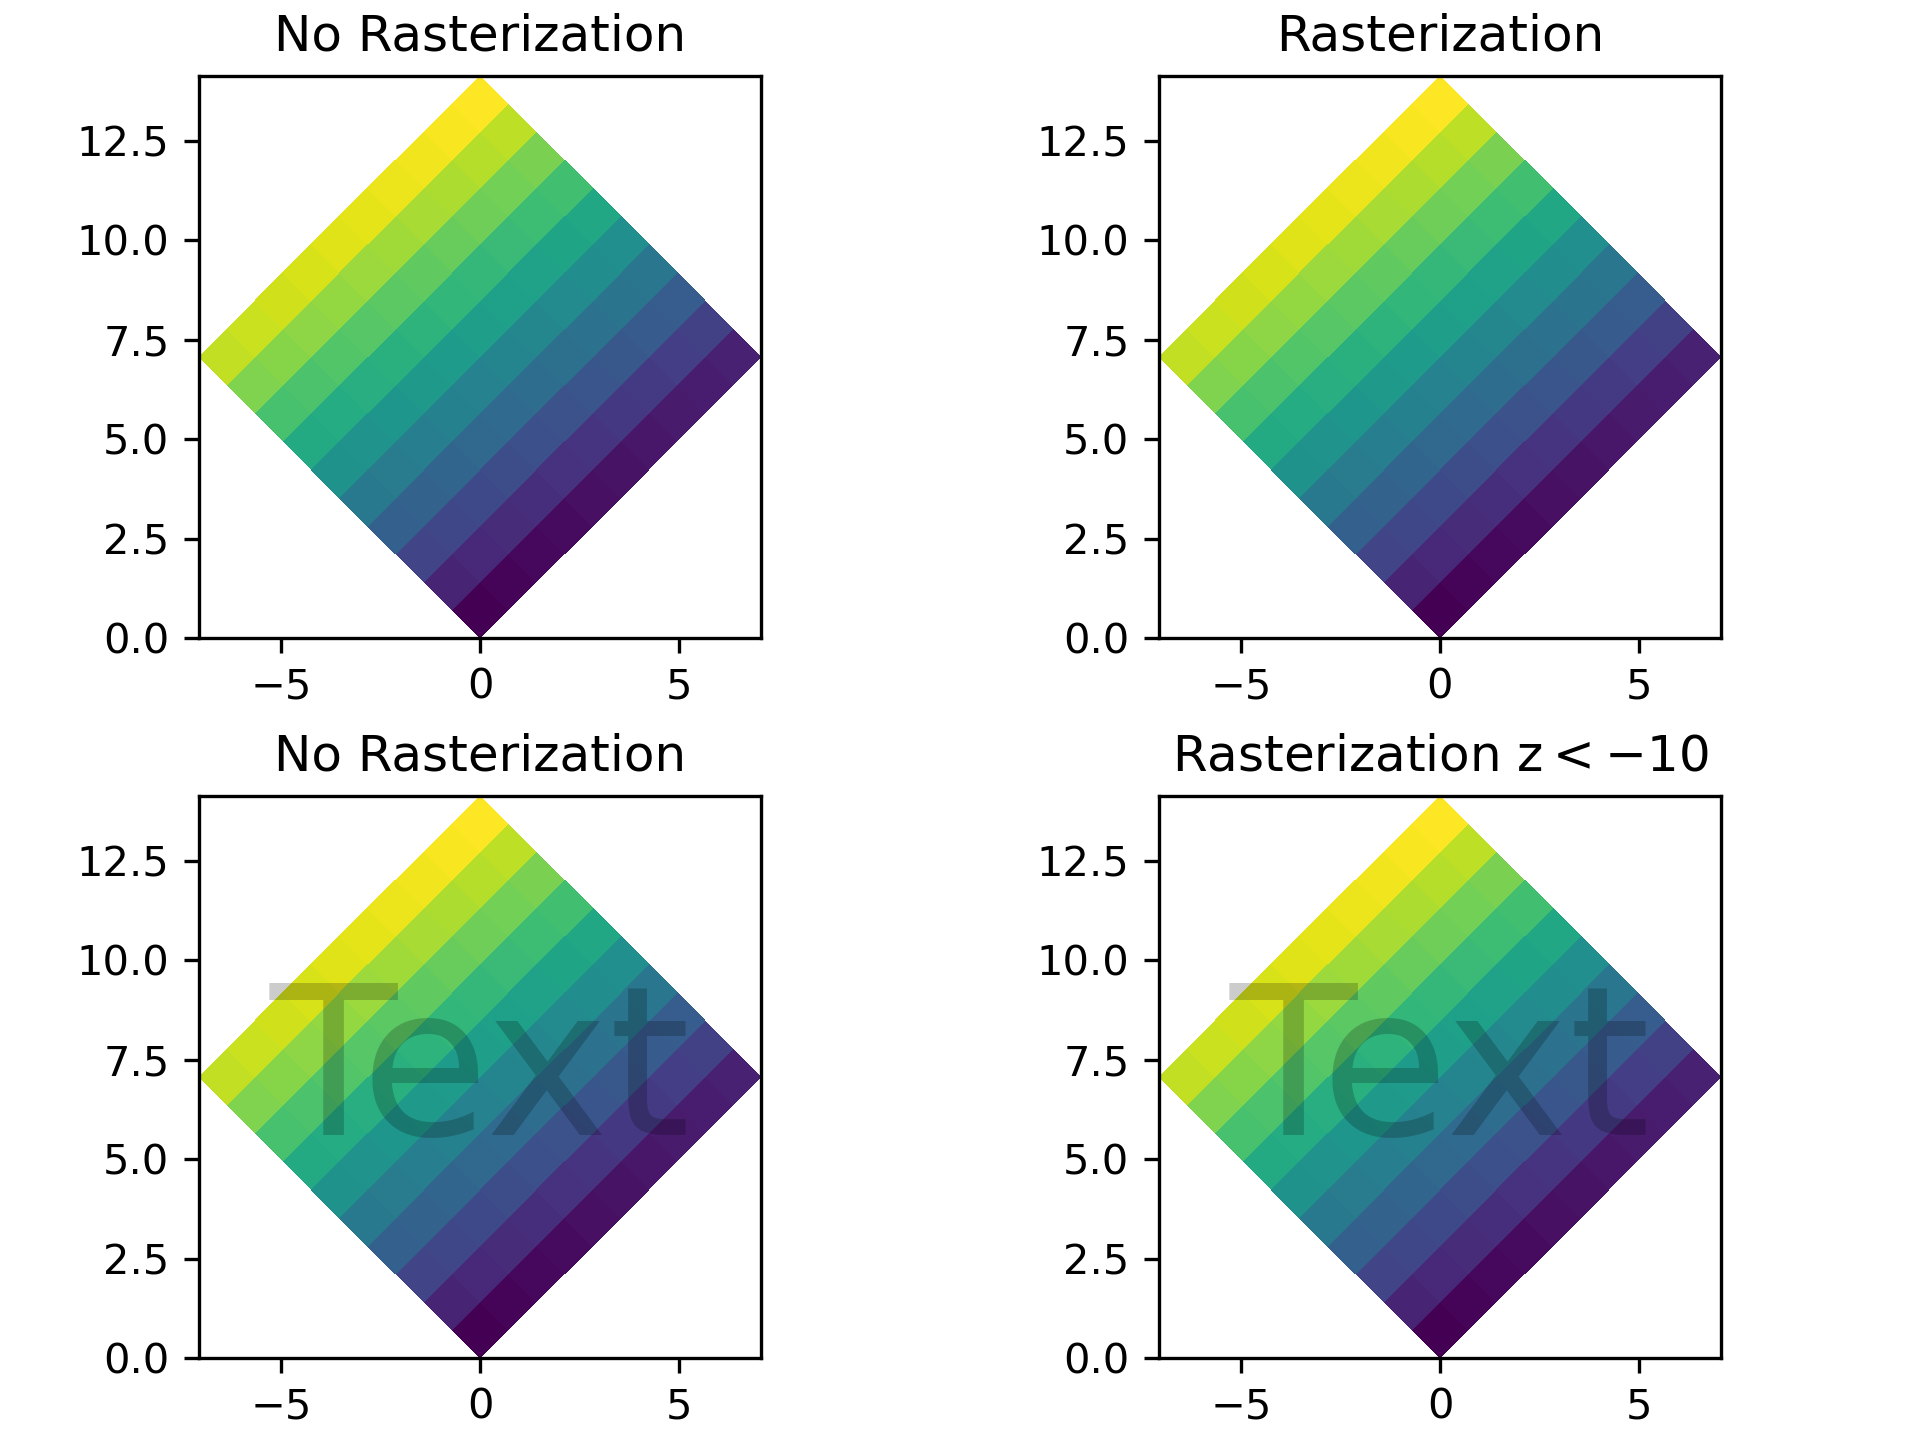
.. note::
The image of this example shown in the HTML documentation is not a vector
graphic. Therefore, it cannot illustrate the rasterization effect. Please
run this example locally and check the generated graphics files.
"""
...
... import numpy as np
... import matplotlib.pyplot as plt
...
... d = np.arange(100).reshape(10, 10) # the values to be color-mapped
... x, y = np.meshgrid(np.arange(11), np.arange(11))
...
... theta = 0.25*np.pi
... xx = x*np.cos(theta) - y*np.sin(theta) # rotate x by -theta
... yy = x*np.sin(theta) + y*np.cos(theta) # rotate y by -theta
...
... fig, ((ax1, ax2), (ax3, ax4)) = plt.subplots(2, 2, constrained_layout=True)
...
... # pcolormesh without rasterization
... ax1.set_aspect(1)
... ax1.pcolormesh(xx, yy, d)
... ax1.set_title("No Rasterization")
...
... # pcolormesh with rasterization; enabled by keyword argument
... ax2.set_aspect(1)
... ax2.set_title("Rasterization")
... m = ax2.pcolormesh(xx, yy, d, rasterized=True)
...
... # pcolormesh with an overlaid text without rasterization
... ax3.set_aspect(1)
... ax3.pcolormesh(xx, yy, d)
... ax3.text(0.5, 0.5, "Text", alpha=0.2,
... va="center", ha="center", size=50, transform=ax3.transAxes)
... ax3.set_title("No Rasterization")
...
... # pcolormesh with an overlaid text without rasterization; enabled by zorder.
... # Setting the rasterization zorder threshold to 0 and a negative zorder on the
... # pcolormesh rasterizes it. All artists have a non-negative zorder by default,
... # so they (e.g. the text here) are not affected.
... ax4.set_aspect(1)
... m = ax4.pcolormesh(xx, yy, d, zorder=-10)
... ax4.text(0.5, 0.5, "Text", alpha=0.2,
... va="center", ha="center", size=50, transform=ax4.transAxes)
... ax4.set_rasterization_zorder(0)
... ax4.set_title("Rasterization z$<-10$")
...
... # Save files in pdf and eps format
... plt.savefig("test_rasterization.pdf", dpi=150)
... plt.savefig("test_rasterization.eps", dpi=150)
...
... if not plt.rcParams["text.usetex"]:
... plt.savefig("test_rasterization.svg", dpi=150)
... # svg backend currently ignores the dpi
...
... #############################################################################
... #
... # .. admonition:: References
... #
... # The use of the following functions, methods, classes and modules is shown
... # in this example:
... #
... # - `matplotlib.artist.Artist.set_rasterized`
... # - `matplotlib.axes.Axes.set_rasterization_zorder`
... # - `matplotlib.axes.Axes.pcolormesh` / `matplotlib.pyplot.pcolormesh`
...