>>> """
============
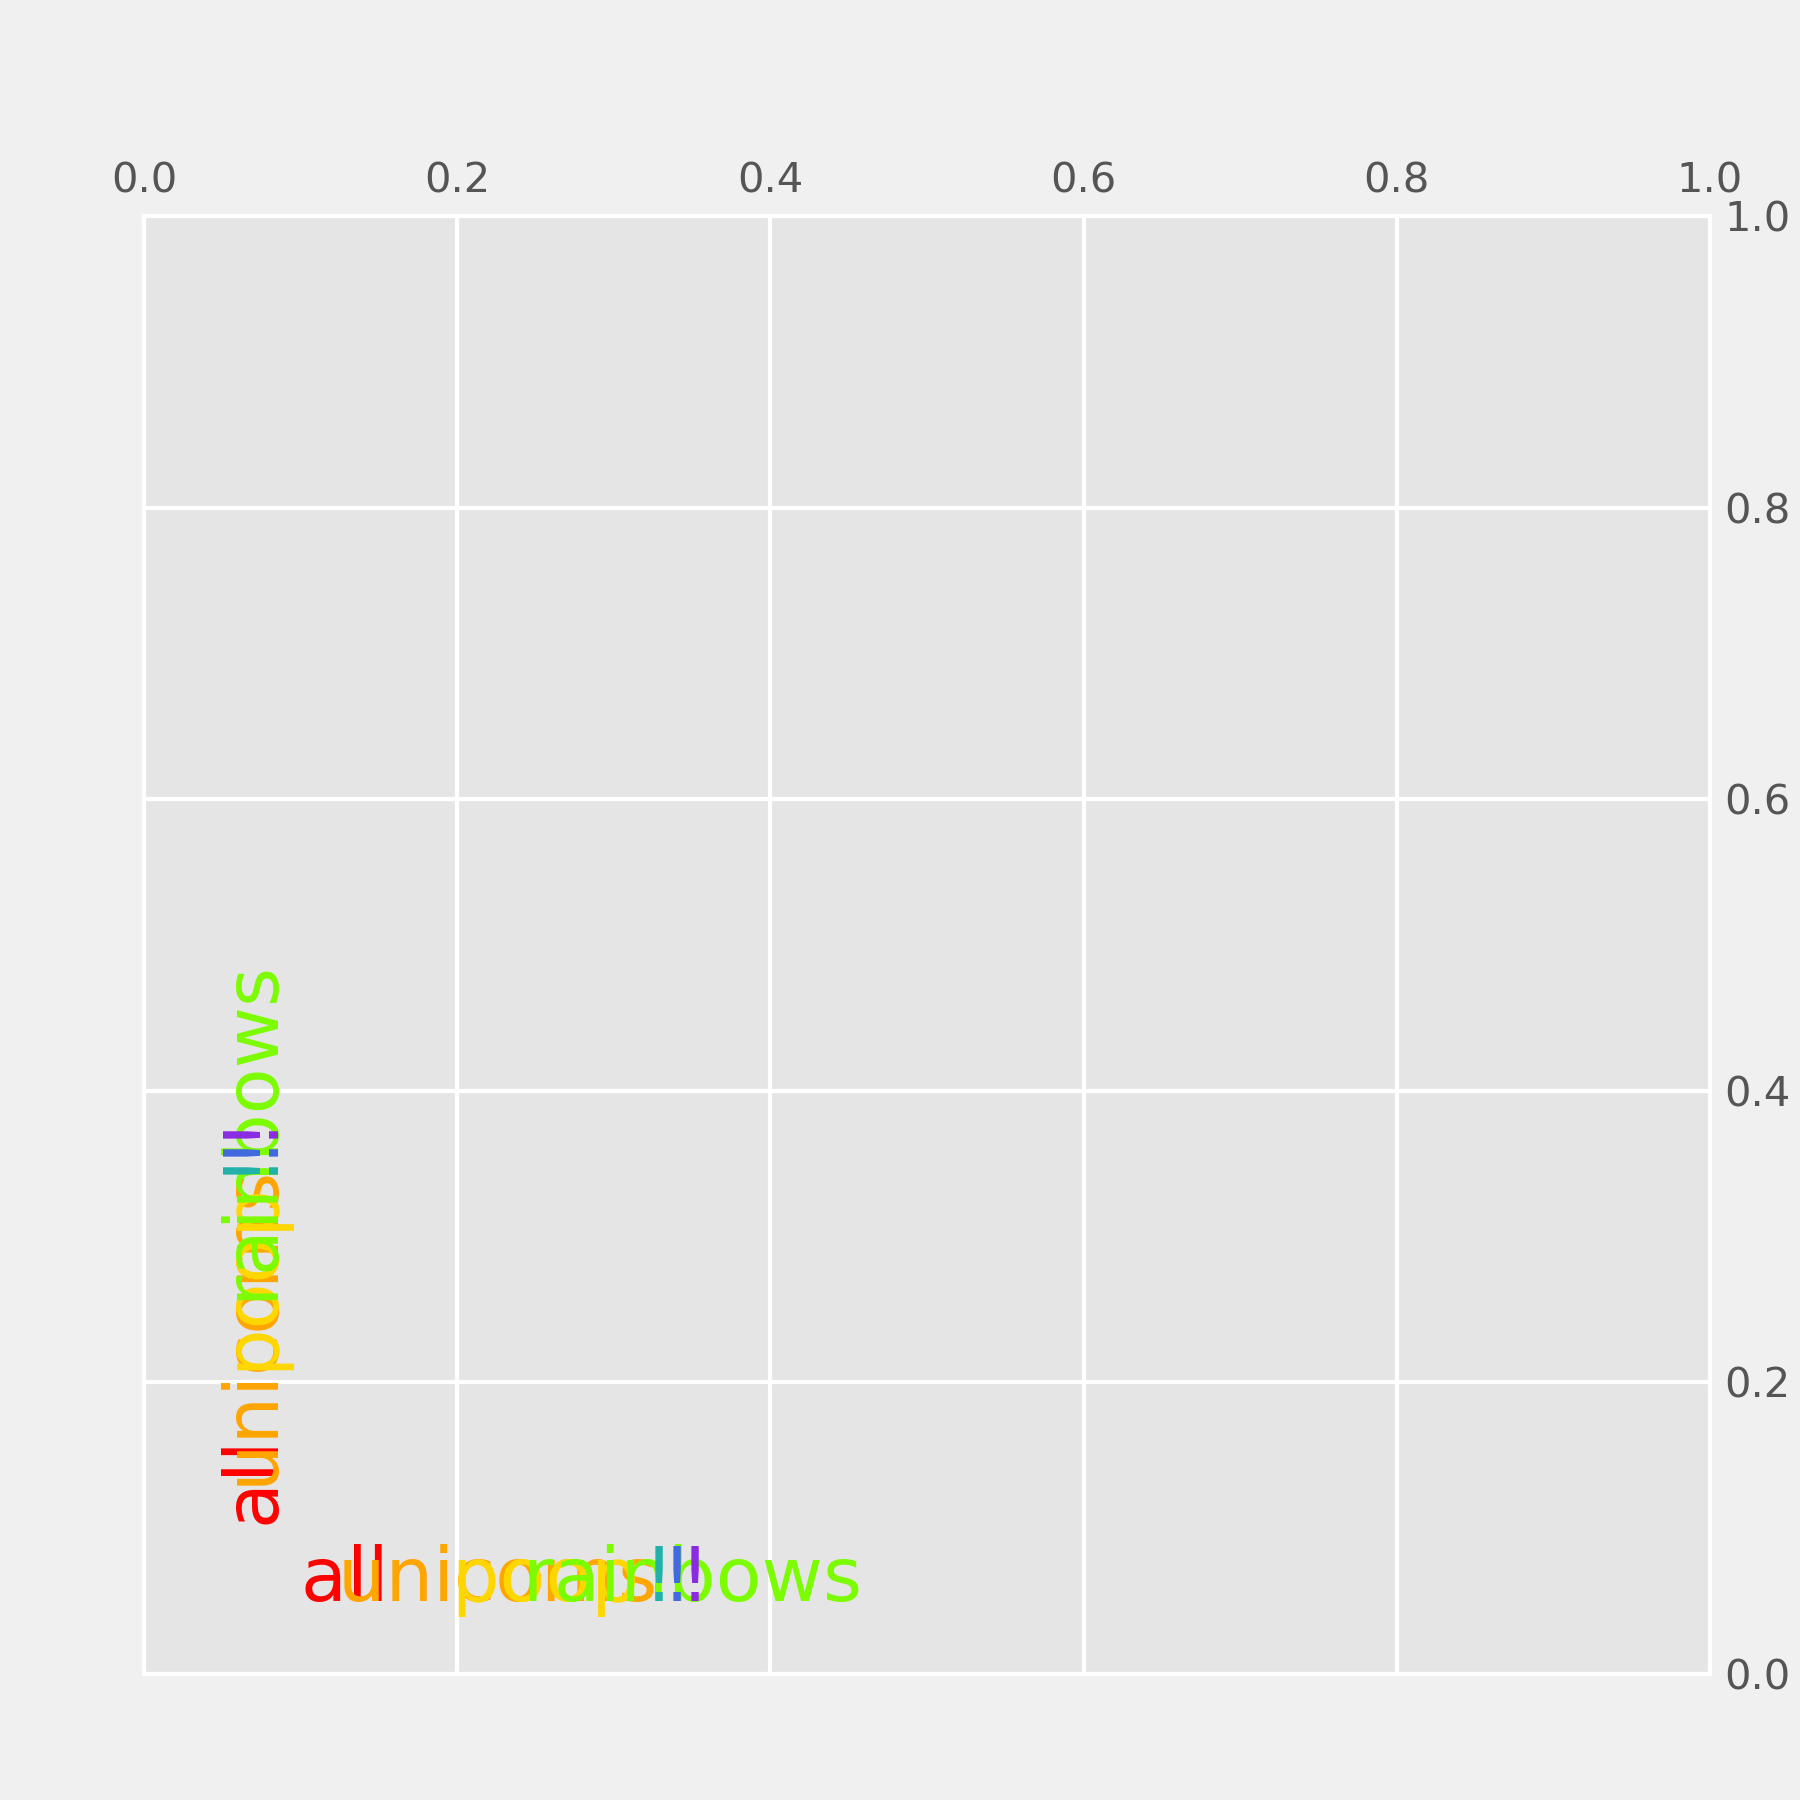
Rainbow text
============
The example shows how to string together several text objects.
History
-------
On the matplotlib-users list back in February 2012, Gökhan Sever asked the
following question:
| Is there a way in matplotlib to partially specify the color of a string?
|
| Example:
|
| plt.ylabel("Today is cloudy.")
|
| How can I show "today" as red, "is" as green and "cloudy." as blue?
|
| Thanks.
The solution below is modified from Paul Ivanov's original answer.
"""
...
... import matplotlib.pyplot as plt
... from matplotlib.transforms import Affine2D
...
...
... def rainbow_text(x, y, strings, colors, orientation='horizontal',
... ax=None, **kwargs):
... """
Take a list of *strings* and *colors* and place them next to each
other, with text strings[i] being shown in colors[i].
Parameters
----------
x, y : float
Text position in data coordinates.
strings : list of str
The strings to draw.
colors : list of color
The colors to use.
orientation : {'horizontal', 'vertical'}
ax : Axes, optional
The Axes to draw into. If None, the current axes will be used.
**kwargs
All other keyword arguments are passed to plt.text(), so you can
set the font size, family, etc.
"""
... if ax is None:
... ax = plt.gca()
... t = ax.transData
... canvas = ax.figure.canvas
...
... assert orientation in ['horizontal', 'vertical']
... if orientation == 'vertical':
... kwargs.update(rotation=90, verticalalignment='bottom')
...
... for s, c in zip(strings, colors):
... text = ax.text(x, y, s + " ", color=c, transform=t, **kwargs)
...
... # Need to draw to update the text position.
... text.draw(canvas.get_renderer())
... ex = text.get_window_extent()
... if orientation == 'horizontal':
... t = text.get_transform() + Affine2D().translate(ex.width, 0)
... else:
... t = text.get_transform() + Affine2D().translate(0, ex.height)
...
...
... words = "all unicorns poop rainbows ! ! !".split()
... colors = ['red', 'orange', 'gold', 'lawngreen', 'lightseagreen', 'royalblue',
... 'blueviolet']
... plt.figure(figsize=(6, 6))
... rainbow_text(0.1, 0.05, words, colors, size=18)
... rainbow_text(0.05, 0.1, words, colors, orientation='vertical', size=18)
...
... plt.show()
...