>>> """
==================
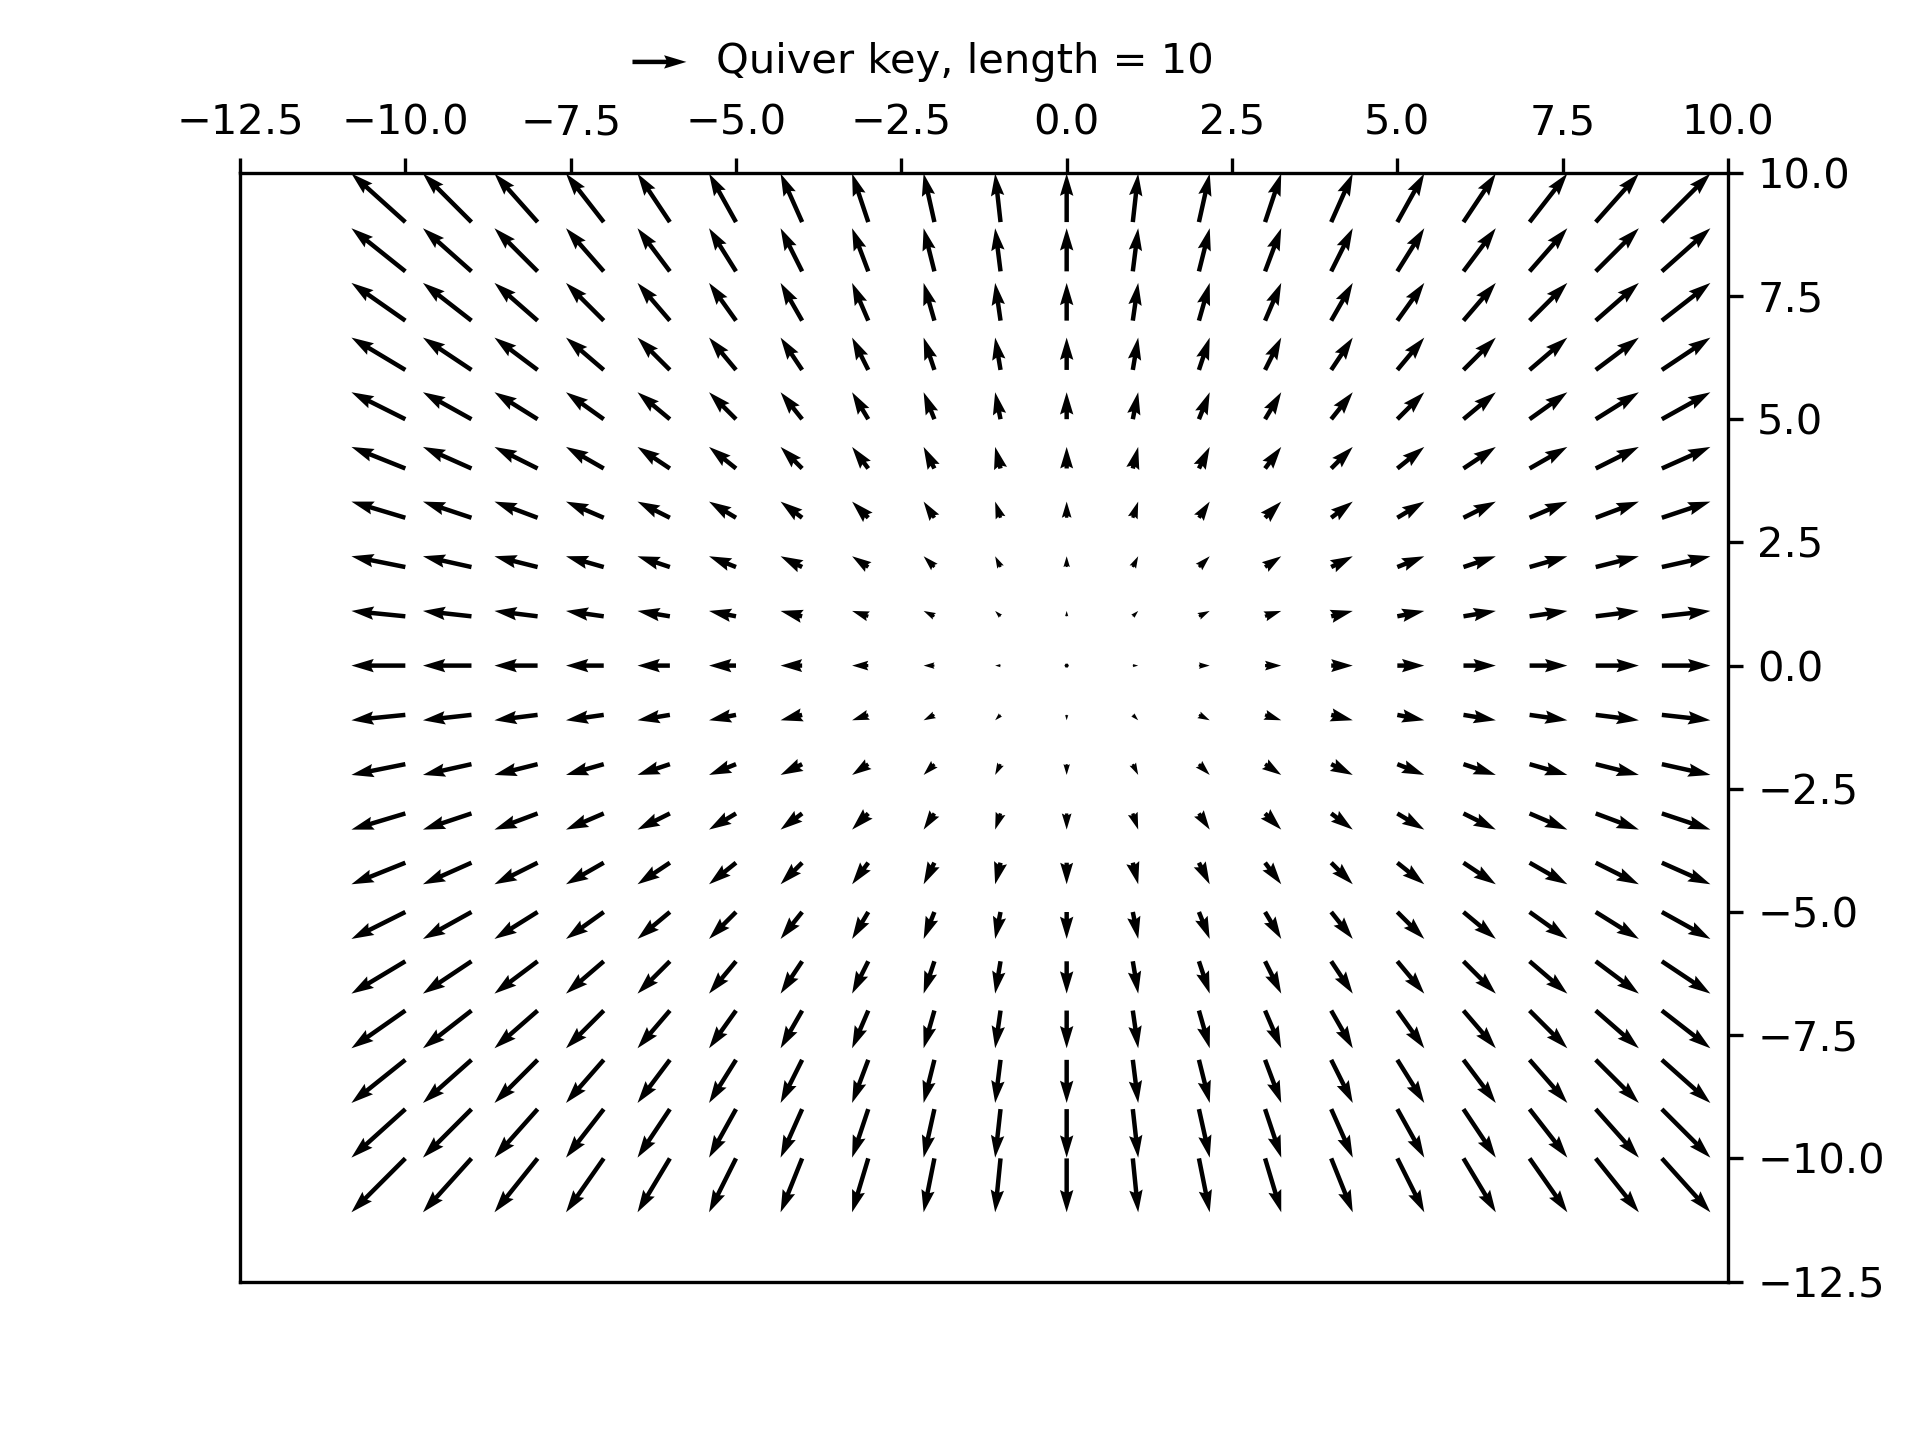
Quiver Simple Demo
==================
A simple example of a `~.axes.Axes.quiver` plot with a `~.axes.Axes.quiverkey`.
For more advanced options refer to
:doc:`/gallery/images_contours_and_fields/quiver_demo`.
"""
... import matplotlib.pyplot as plt
... import numpy as np
...
... X = np.arange(-10, 10, 1)
... Y = np.arange(-10, 10, 1)
... U, V = np.meshgrid(X, Y)
...
... fig, ax = plt.subplots()
... q = ax.quiver(X, Y, U, V)
... ax.quiverkey(q, X=0.3, Y=1.1, U=10,
... label='Quiver key, length = 10', labelpos='E')
...
... plt.show()
...
... #############################################################################
... #
... # .. admonition:: References
... #
... # The use of the following functions, methods, classes and modules is shown
... # in this example:
... #
... # - `matplotlib.axes.Axes.quiver` / `matplotlib.pyplot.quiver`
... # - `matplotlib.axes.Axes.quiverkey` / `matplotlib.pyplot.quiverkey`
...