>>> """
==============
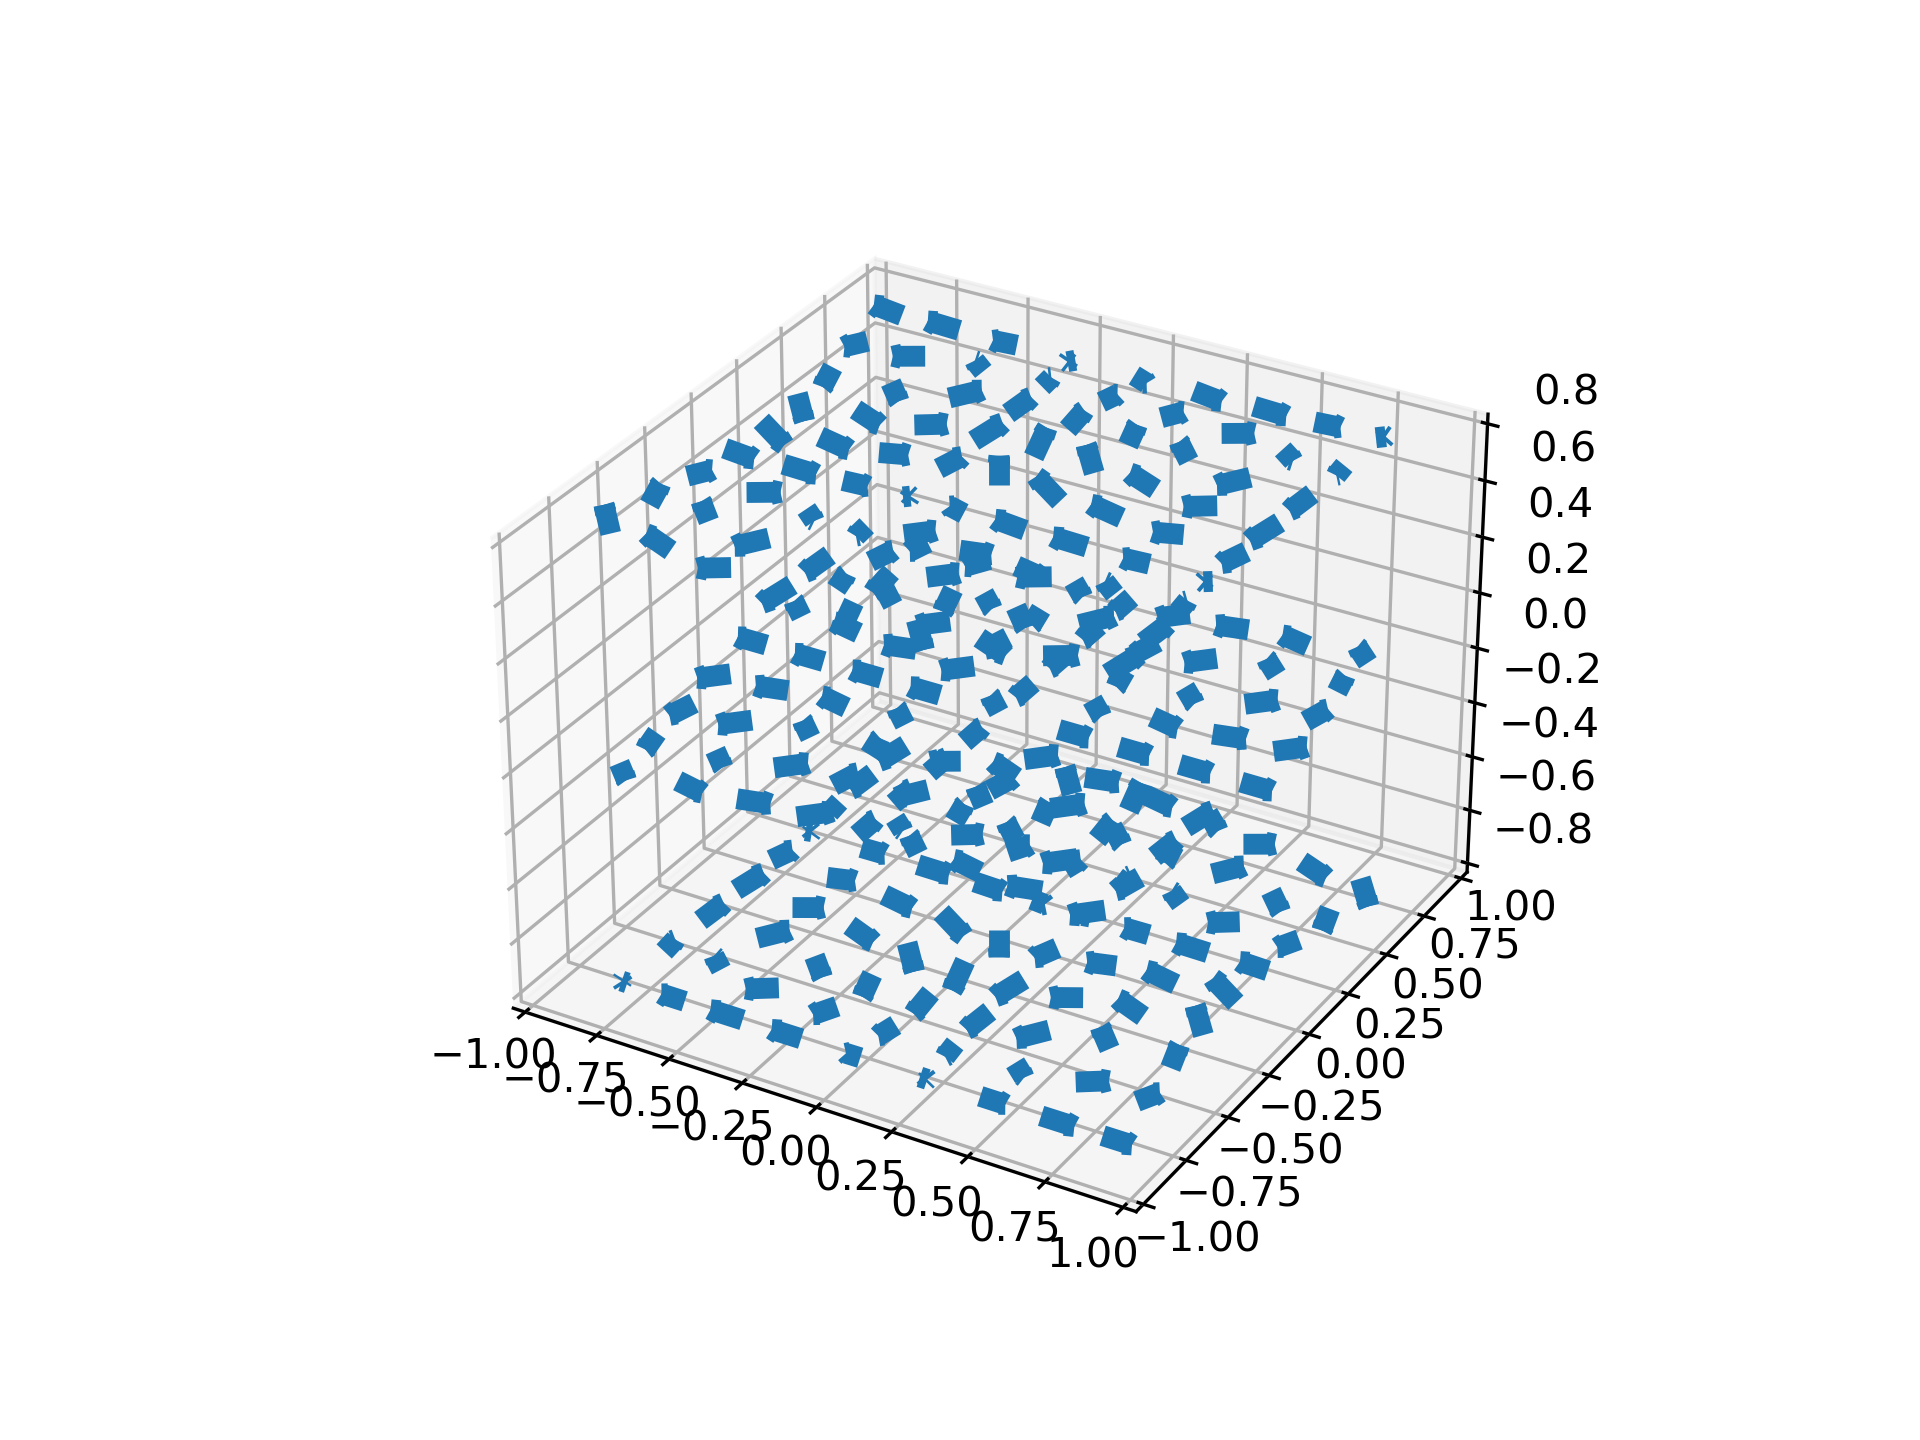
3D quiver plot
==============
Demonstrates plotting directional arrows at points on a 3D meshgrid.
"""
...
... import matplotlib.pyplot as plt
... import numpy as np
...
... ax = plt.figure().add_subplot(projection='3d')
...
... # Make the grid
... x, y, z = np.meshgrid(np.arange(-0.8, 1, 0.2),
... np.arange(-0.8, 1, 0.2),
... np.arange(-0.8, 1, 0.8))
...
... # Make the direction data for the arrows
... u = np.sin(np.pi * x) * np.cos(np.pi * y) * np.cos(np.pi * z)
... v = -np.cos(np.pi * x) * np.sin(np.pi * y) * np.cos(np.pi * z)
... w = (np.sqrt(2.0 / 3.0) * np.cos(np.pi * x) * np.cos(np.pi * y) *
... np.sin(np.pi * z))
...
... ax.quiver(x, y, z, u, v, w, length=0.1, normalize=True)
...
... plt.show()
...