>>> """
=============
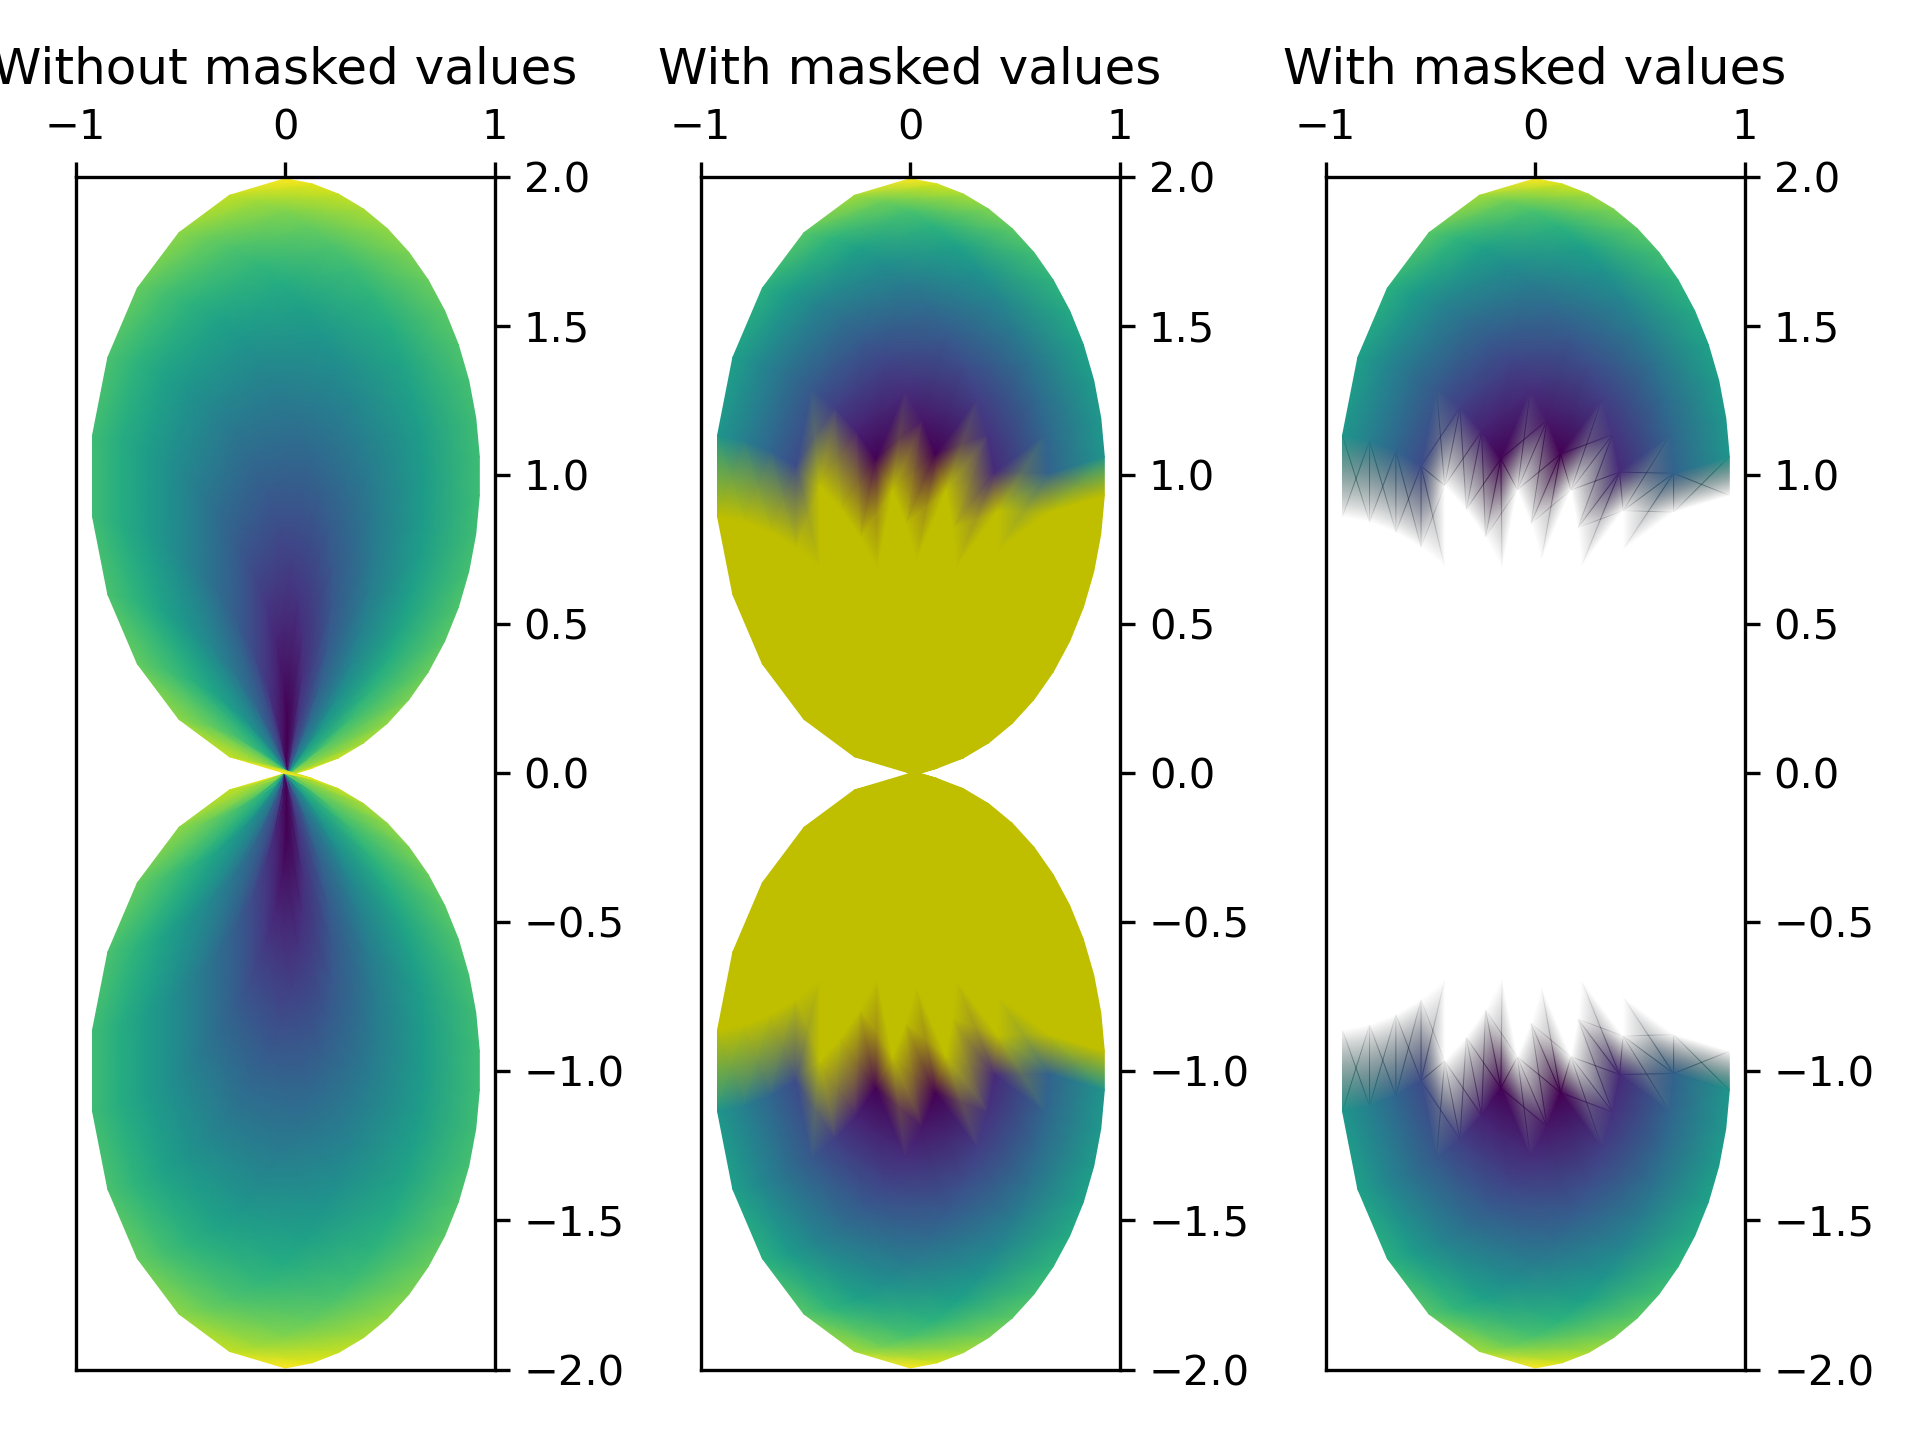
QuadMesh Demo
=============
`~.axes.Axes.pcolormesh` uses a `~matplotlib.collections.QuadMesh`,
a faster generalization of `~.axes.Axes.pcolor`, but with some restrictions.
This demo illustrates a bug in quadmesh with masked data.
"""
...
... from matplotlib import pyplot as plt
... import numpy as np
...
... n = 12
... x = np.linspace(-1.5, 1.5, n)
... y = np.linspace(-1.5, 1.5, n * 2)
... X, Y = np.meshgrid(x, y)
... Qx = np.cos(Y) - np.cos(X)
... Qz = np.sin(Y) + np.sin(X)
... Z = np.sqrt(X**2 + Y**2) / 5
... Z = (Z - Z.min()) / (Z.max() - Z.min())
...
... # The color array can include masked values.
... Zm = np.ma.masked_where(np.abs(Qz) < 0.5 * np.max(Qz), Z)
...
... fig, axs = plt.subplots(nrows=1, ncols=3)
... axs[0].pcolormesh(Qx, Qz, Z, shading='gouraud')
... axs[0].set_title('Without masked values')
...
... # You can control the color of the masked region.
... cmap = plt.colormaps[plt.rcParams['image.cmap']].with_extremes(bad='y')
... axs[1].pcolormesh(Qx, Qz, Zm, shading='gouraud', cmap=cmap)
... axs[1].set_title('With masked values')
...
... # Or use the default, which is transparent.
... axs[2].pcolormesh(Qx, Qz, Zm, shading='gouraud')
... axs[2].set_title('With masked values')
...
... fig.tight_layout()
... plt.show()
...
... #############################################################################
... #
... # .. admonition:: References
... #
... # The use of the following functions, methods, classes and modules is shown
... # in this example:
... #
... # - `matplotlib.axes.Axes.pcolormesh` / `matplotlib.pyplot.pcolormesh`
...