>>> """
============
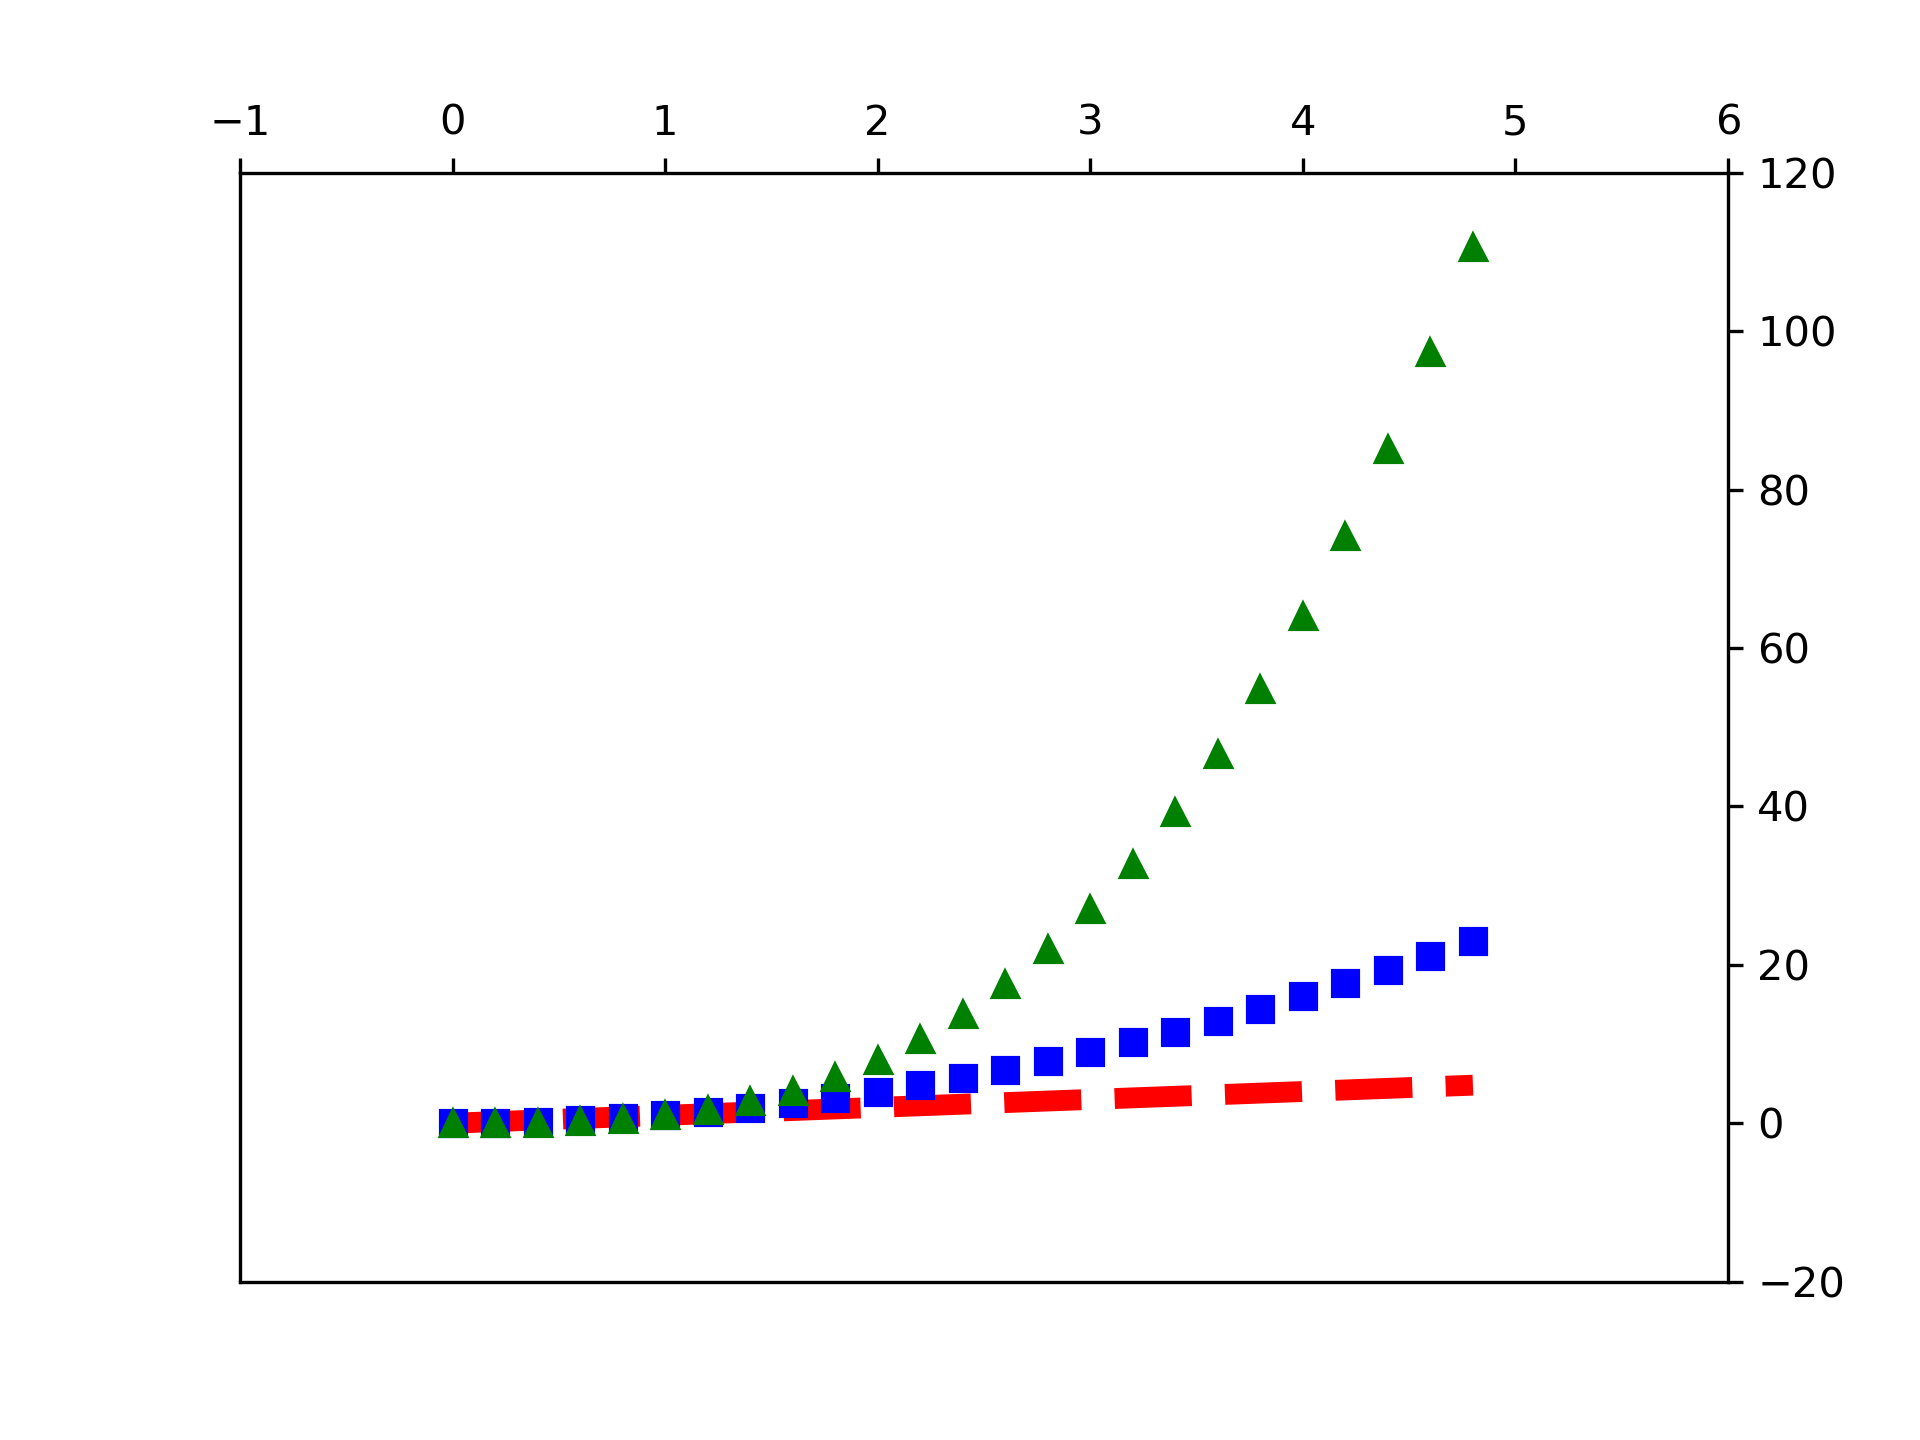
Pyplot Three
============
Plot three line plots in a single call to `~matplotlib.pyplot.plot`.
"""
... import numpy as np
... import matplotlib.pyplot as plt
...
... # evenly sampled time at 200ms intervals
... t = np.arange(0., 5., 0.2)
...
... # red dashes, blue squares and green triangles
... plt.plot(t, t, 'r--', t, t**2, 'bs', t, t**3, 'g^')
... plt.show()
...
... #############################################################################
... #
... # .. admonition:: References
... #
... # The use of the following functions, methods, classes and modules is shown
... # in this example:
... #
... # - `matplotlib.axes.Axes.plot` / `matplotlib.pyplot.plot`
...