>>> """
===========
Pyplot Text
===========
"""
... import numpy as np
... import matplotlib.pyplot as plt
...
... # Fixing random state for reproducibility
... np.random.seed(19680801)
...
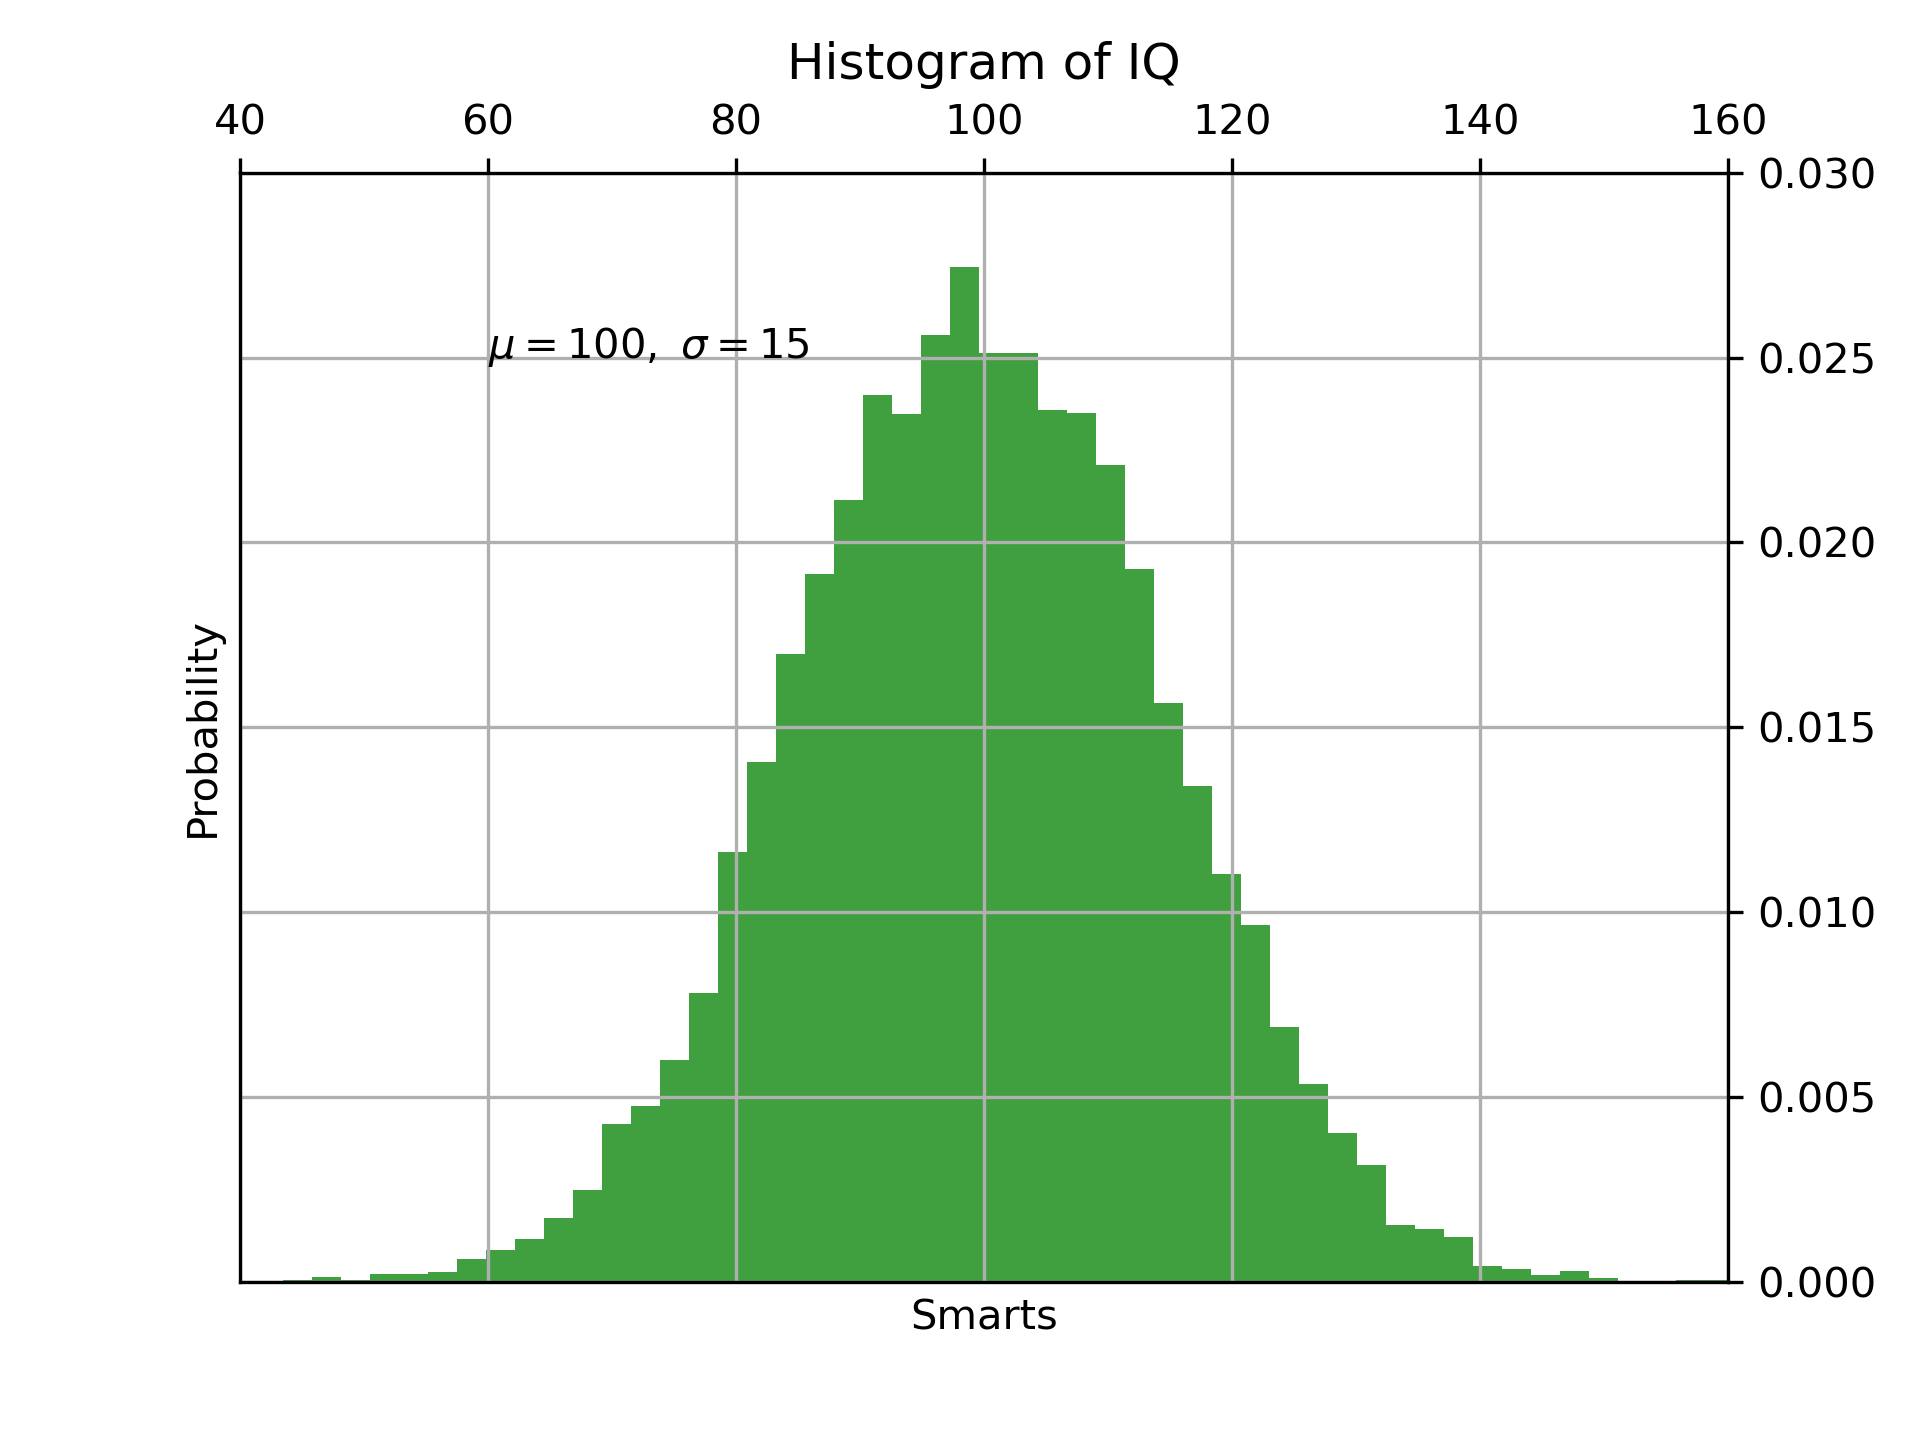
... mu, sigma = 100, 15
... x = mu + sigma * np.random.randn(10000)
...
... # the histogram of the data
... n, bins, patches = plt.hist(x, 50, density=True, facecolor='g', alpha=0.75)
...
...
... plt.xlabel('Smarts')
... plt.ylabel('Probability')
... plt.title('Histogram of IQ')
... plt.text(60, .025, r'$\mu=100,\ \sigma=15$')
... plt.xlim(40, 160)
... plt.ylim(0, 0.03)
... plt.grid(True)
... plt.show()
...
... #############################################################################
... #
... # .. admonition:: References
... #
... # The use of the following functions, methods, classes and modules is shown
... # in this example:
... #
... # - `matplotlib.pyplot.hist`
... # - `matplotlib.pyplot.xlabel`
... # - `matplotlib.pyplot.ylabel`
... # - `matplotlib.pyplot.text`
... # - `matplotlib.pyplot.grid`
... # - `matplotlib.pyplot.show`
...