>>> """
=============
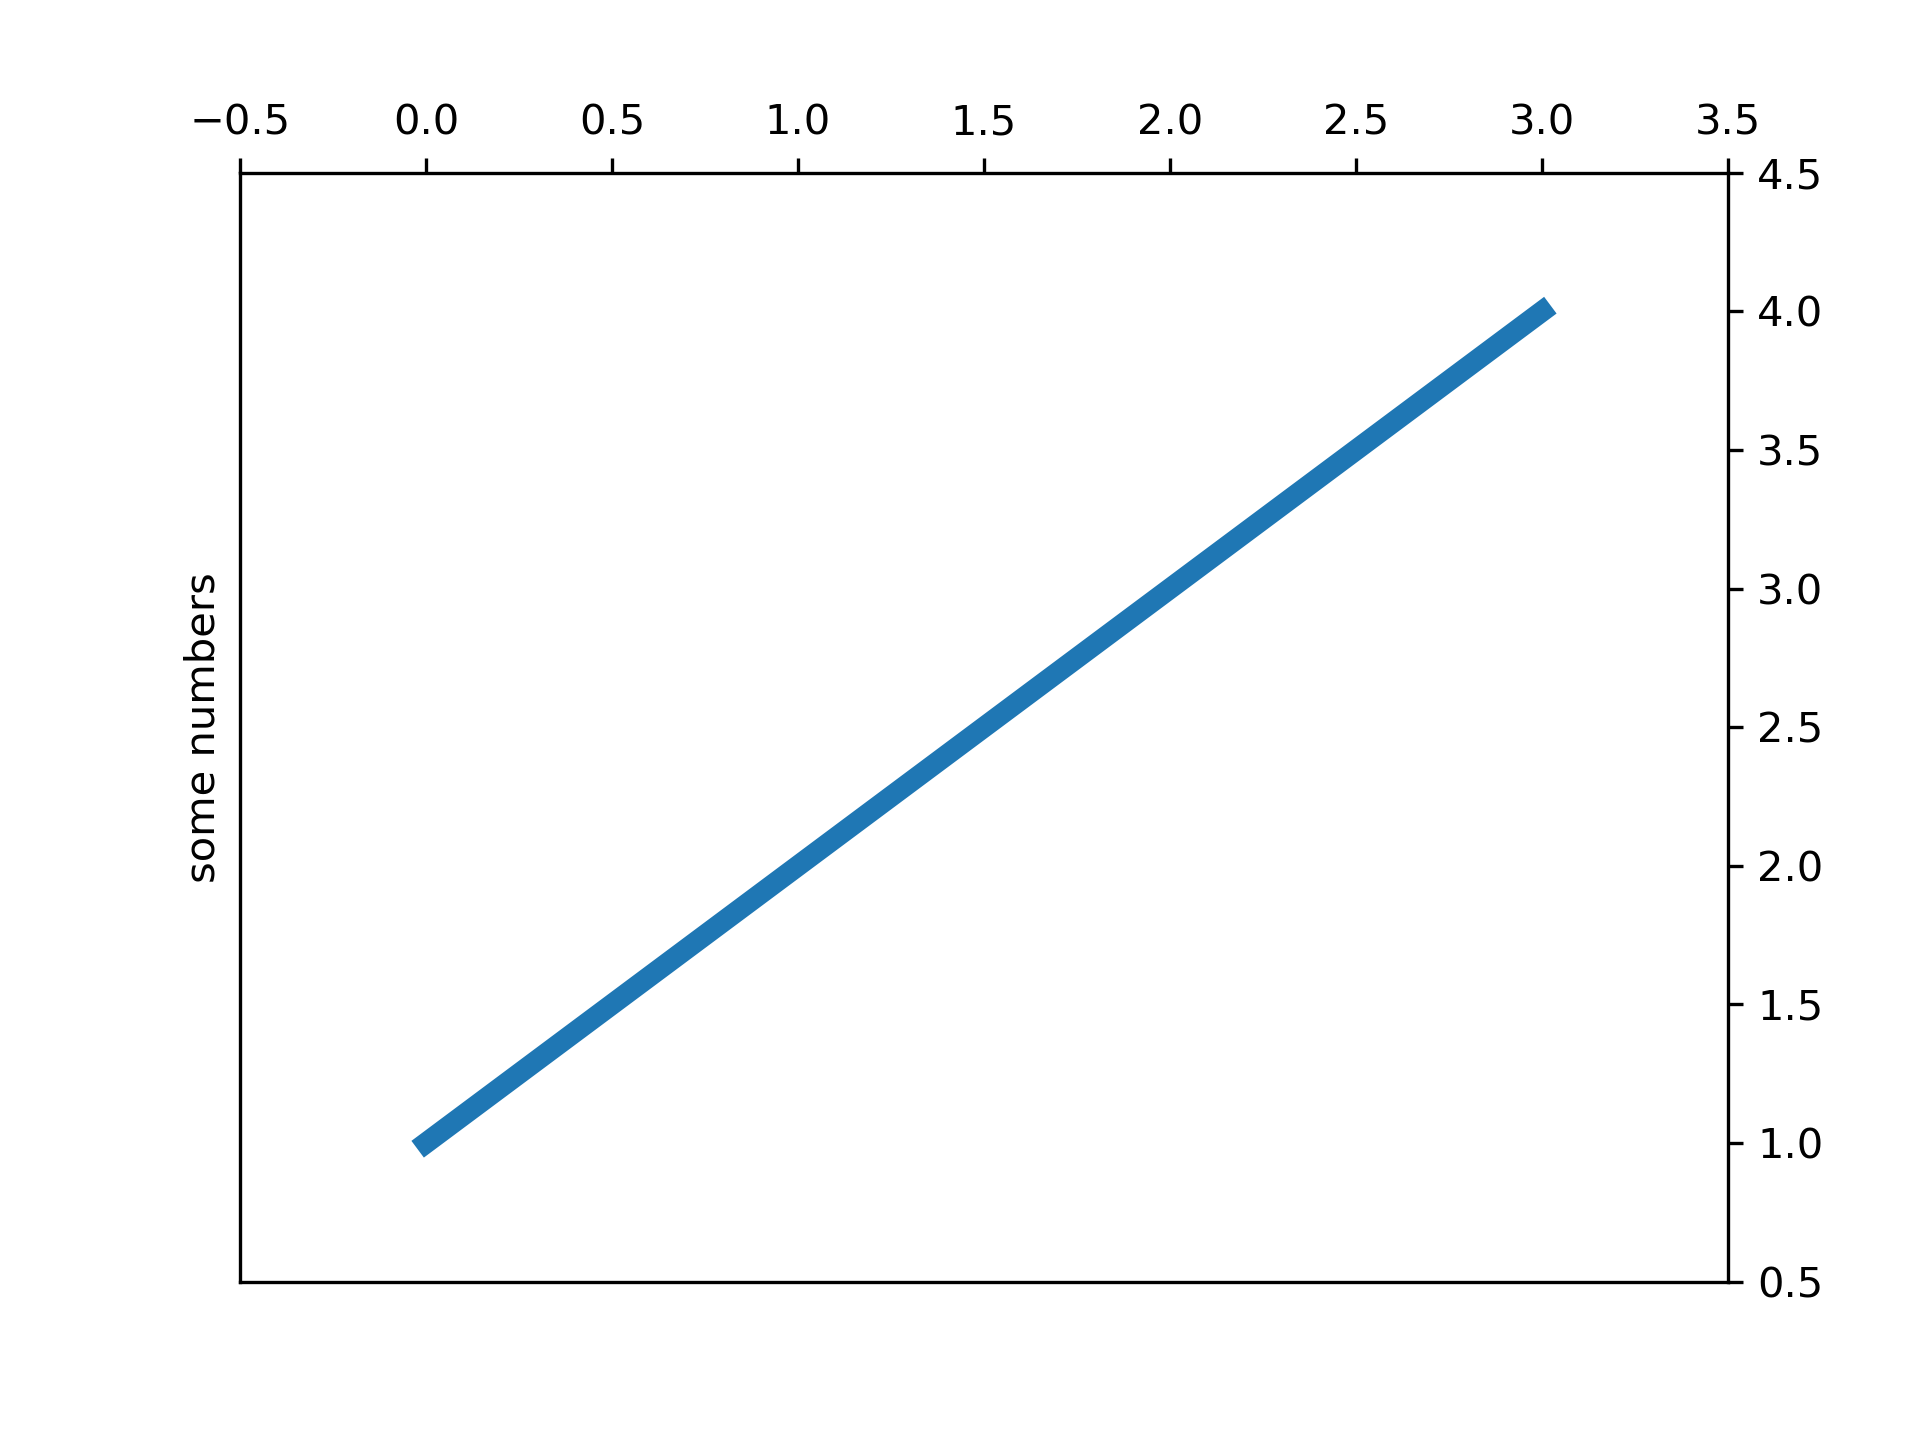
Pyplot Simple
=============
A very simple pyplot where a list of numbers are ploted against their
index. Creates a straight line due to the rate of change being 1 for
both the X and Y axis.
"""
... import matplotlib.pyplot as plt
... plt.plot([1, 2, 3, 4])
... plt.ylabel('some numbers')
... plt.show()
...
... #############################################################################
... #
... # .. admonition:: References
... #
... # The use of the following functions, methods, classes and modules is shown
... # in this example:
... #
... # - `matplotlib.pyplot.plot`
... # - `matplotlib.pyplot.ylabel`
... # - `matplotlib.pyplot.show`
...