>>> """
===============
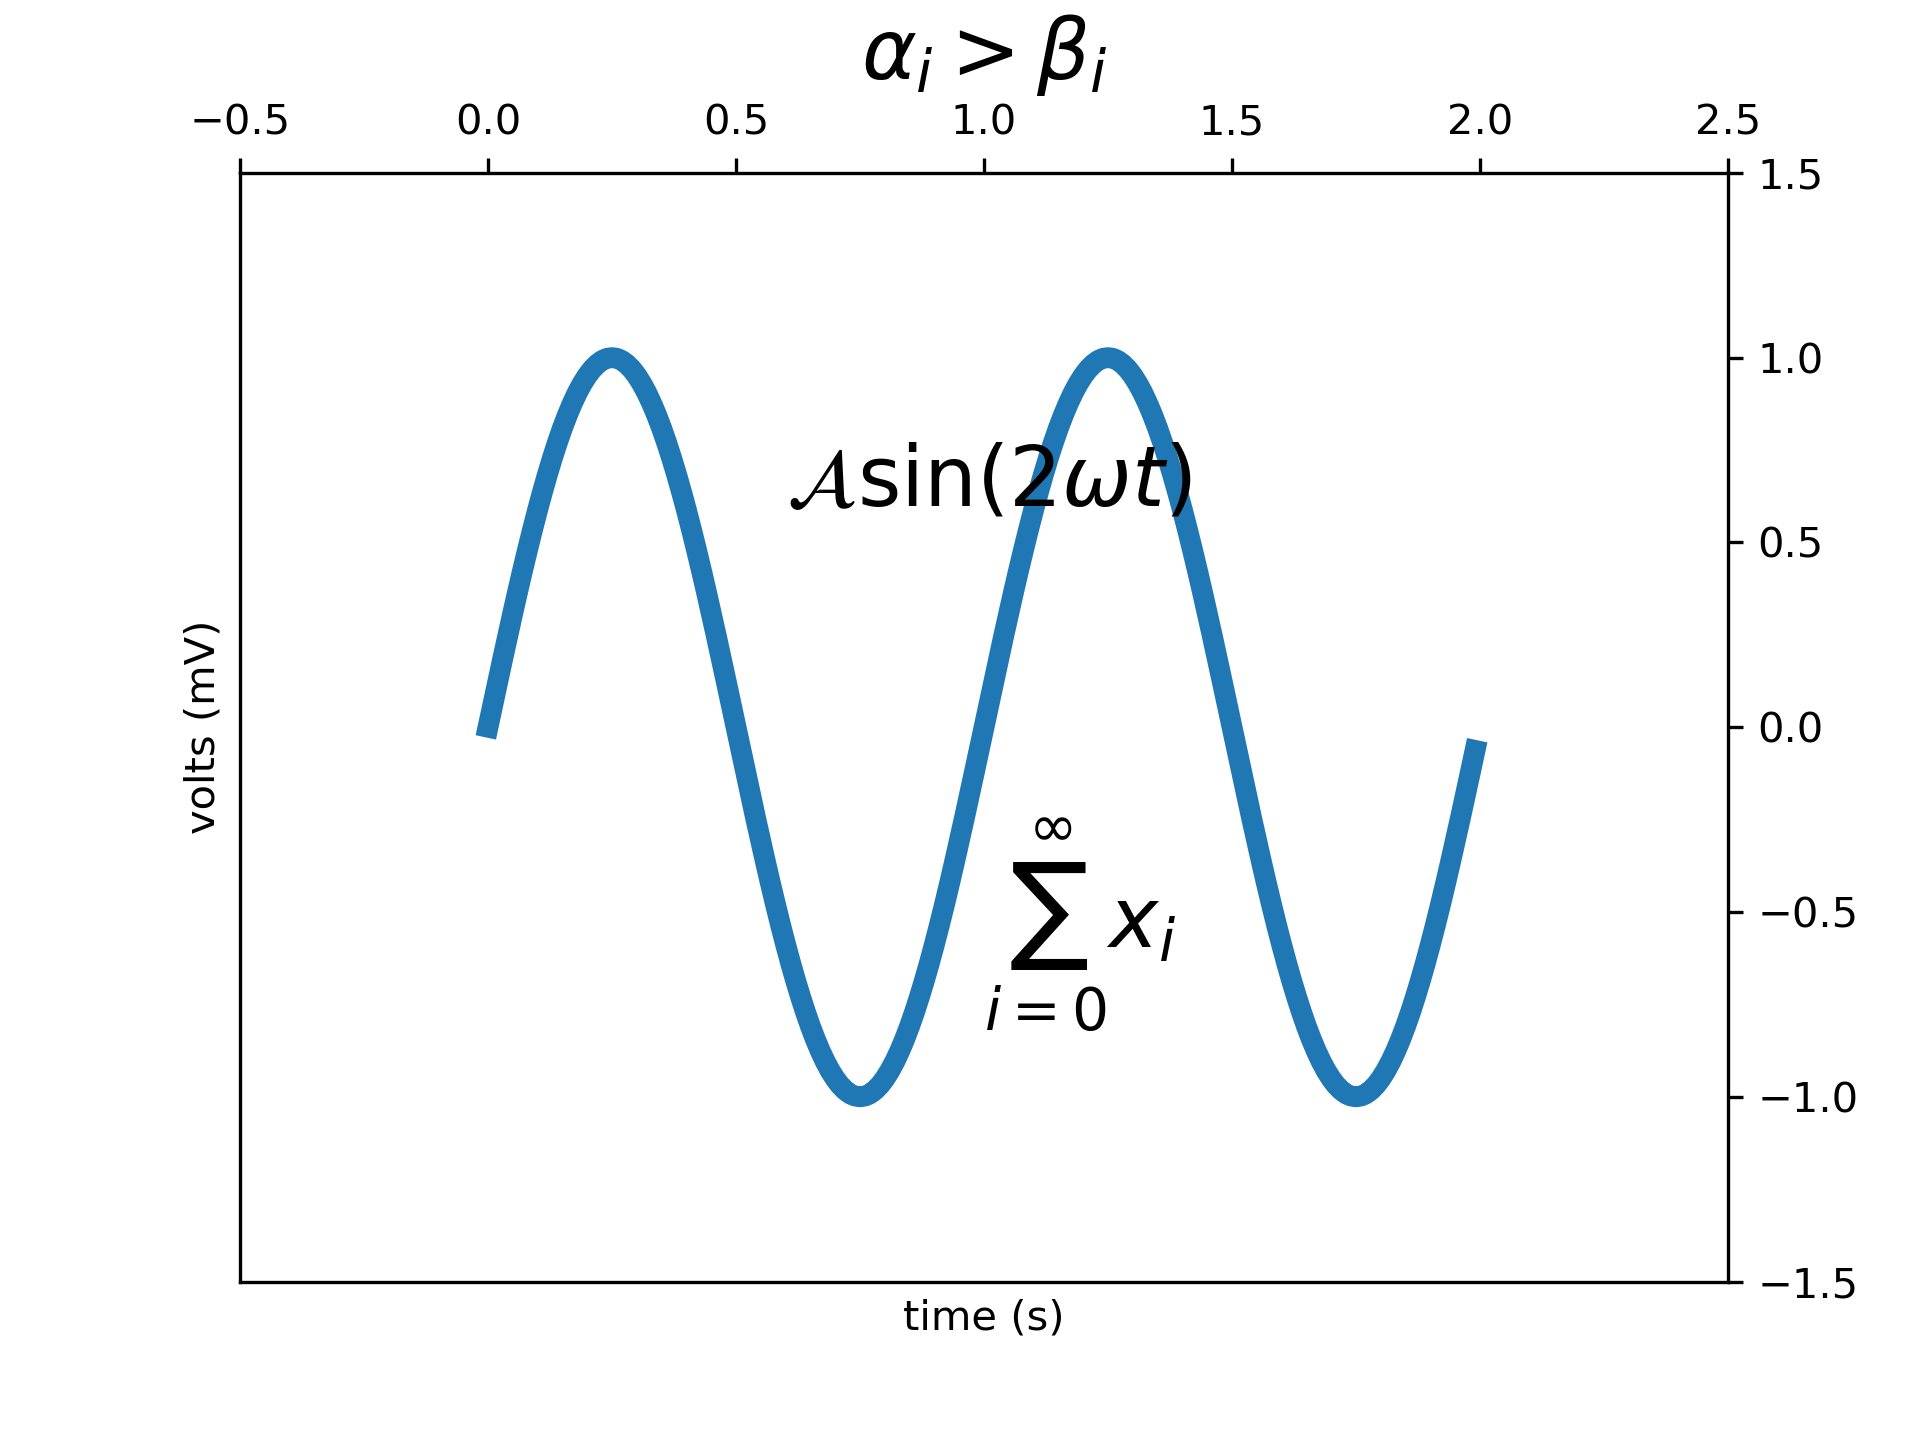
Pyplot Mathtext
===============
Use mathematical expressions in text labels. For an overview over MathText
see :doc:`/tutorials/text/mathtext`.
"""
... import numpy as np
... import matplotlib.pyplot as plt
... t = np.arange(0.0, 2.0, 0.01)
... s = np.sin(2*np.pi*t)
...
... plt.plot(t, s)
... plt.title(r'$\alpha_i > \beta_i$', fontsize=20)
... plt.text(1, -0.6, r'$\sum_{i=0}^\infty x_i$', fontsize=20)
... plt.text(0.6, 0.6, r'$\mathcal{A}\mathrm{sin}(2 \omega t)$',
... fontsize=20)
... plt.xlabel('time (s)')
... plt.ylabel('volts (mV)')
... plt.show()
...
... #############################################################################
... #
... # .. admonition:: References
... #
... # The use of the following functions, methods, classes and modules is shown
... # in this example:
... #
... # - `matplotlib.axes.Axes.text` / `matplotlib.pyplot.text`
...