>>> """
====================
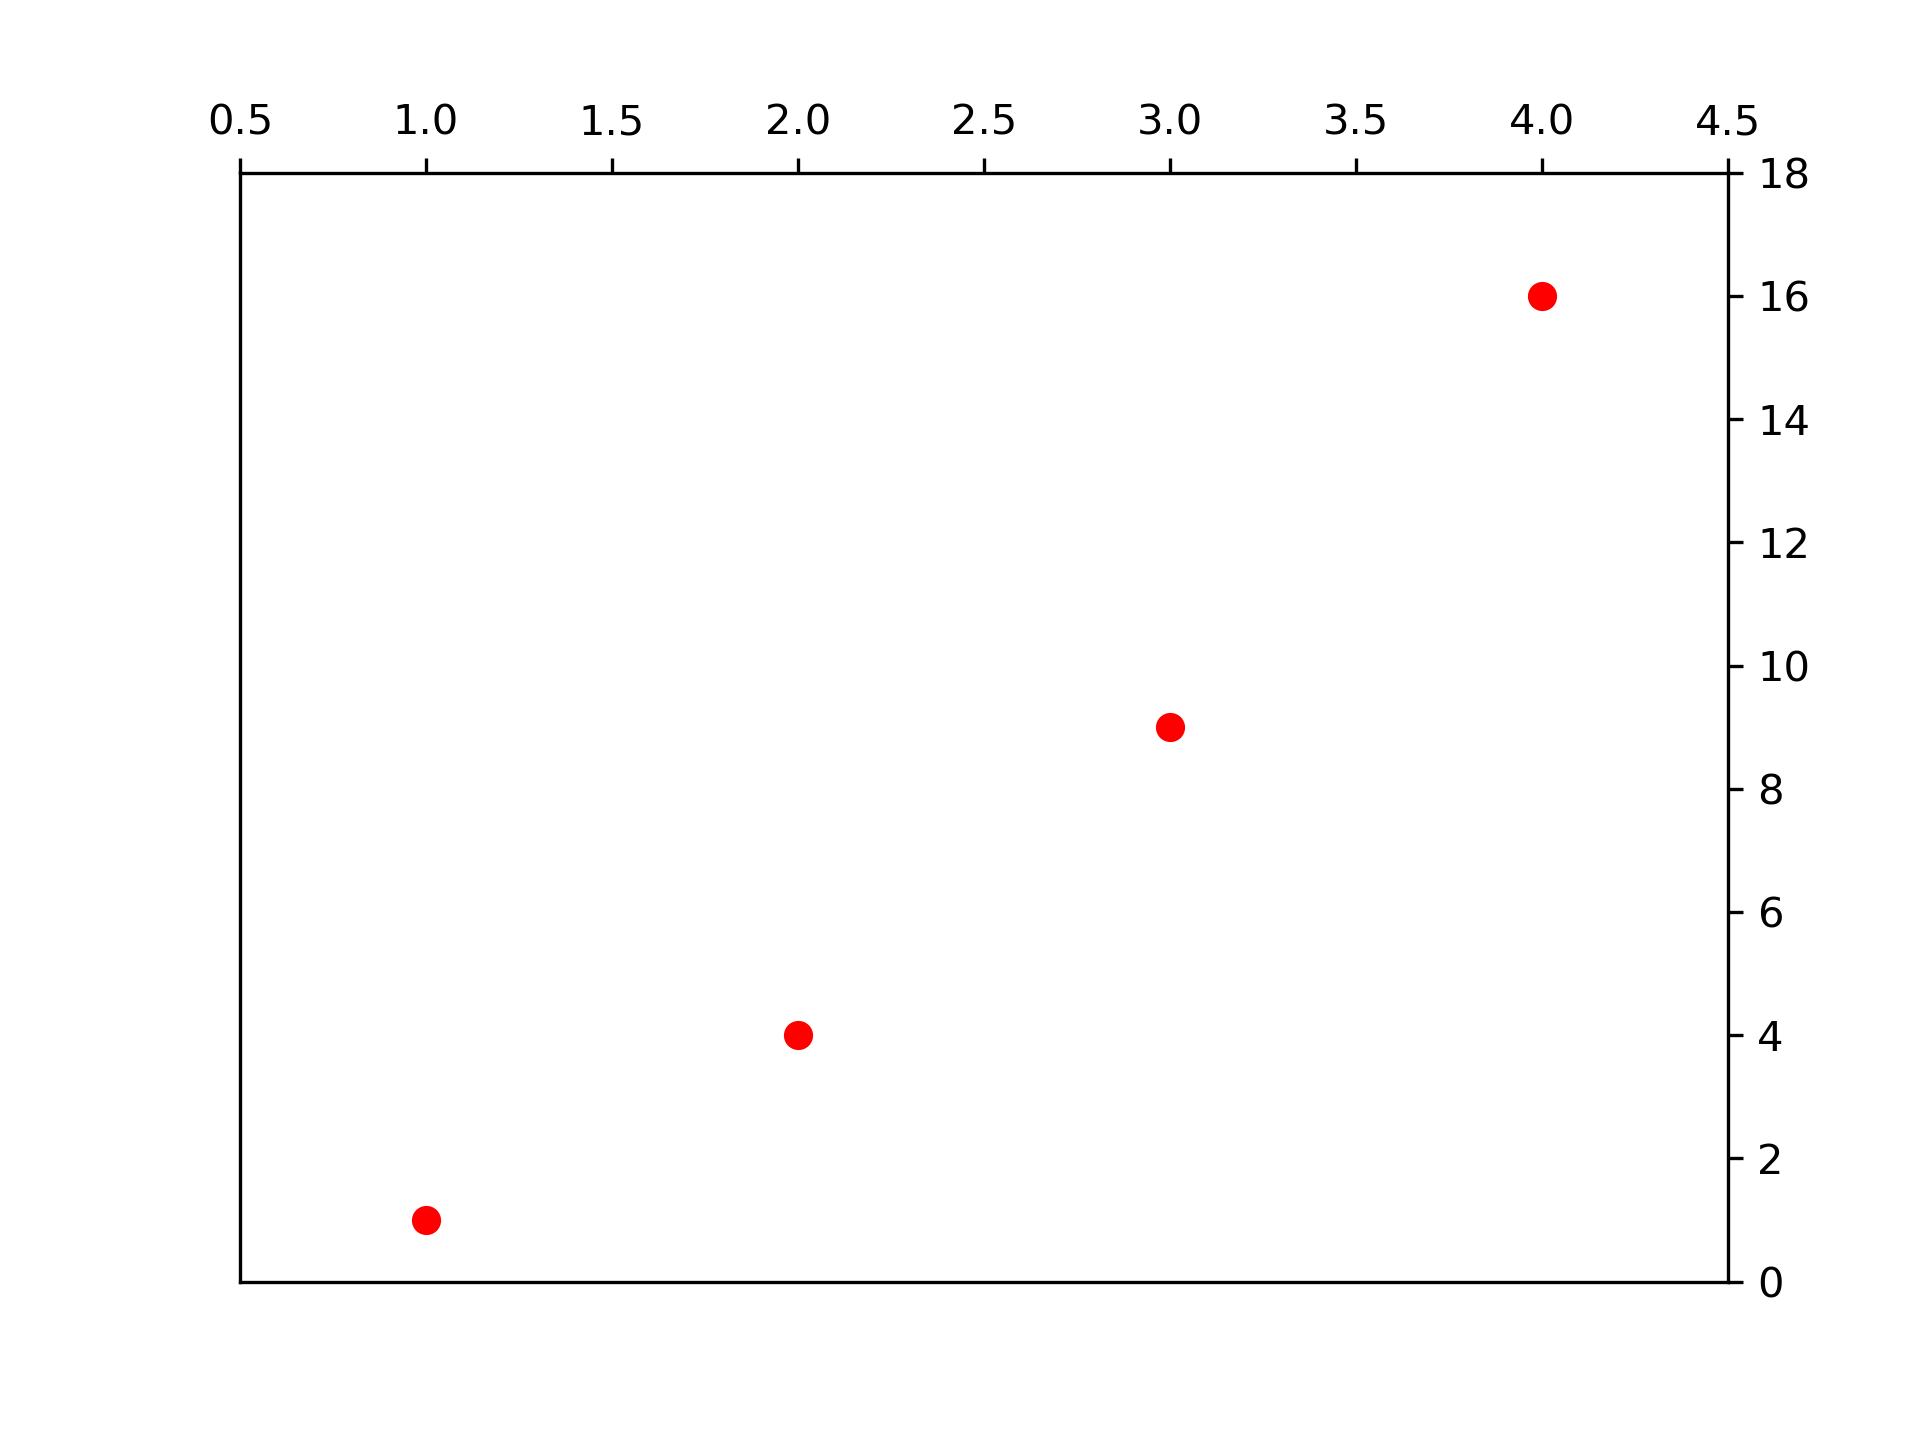
plot() format string
====================
Use a format string (here, 'ro') to set the color and markers of a
`~matplotlib.axes.Axes.plot`.
"""
...
... import matplotlib.pyplot as plt
... plt.plot([1, 2, 3, 4], [1, 4, 9, 16], 'ro')
... plt.show()
...
... #############################################################################
... #
... # .. admonition:: References
... #
... # The use of the following functions, methods, classes and modules is shown
... # in this example:
... #
... # - `matplotlib.axes.Axes.plot` / `matplotlib.pyplot.plot`
...