>>> """
=======================
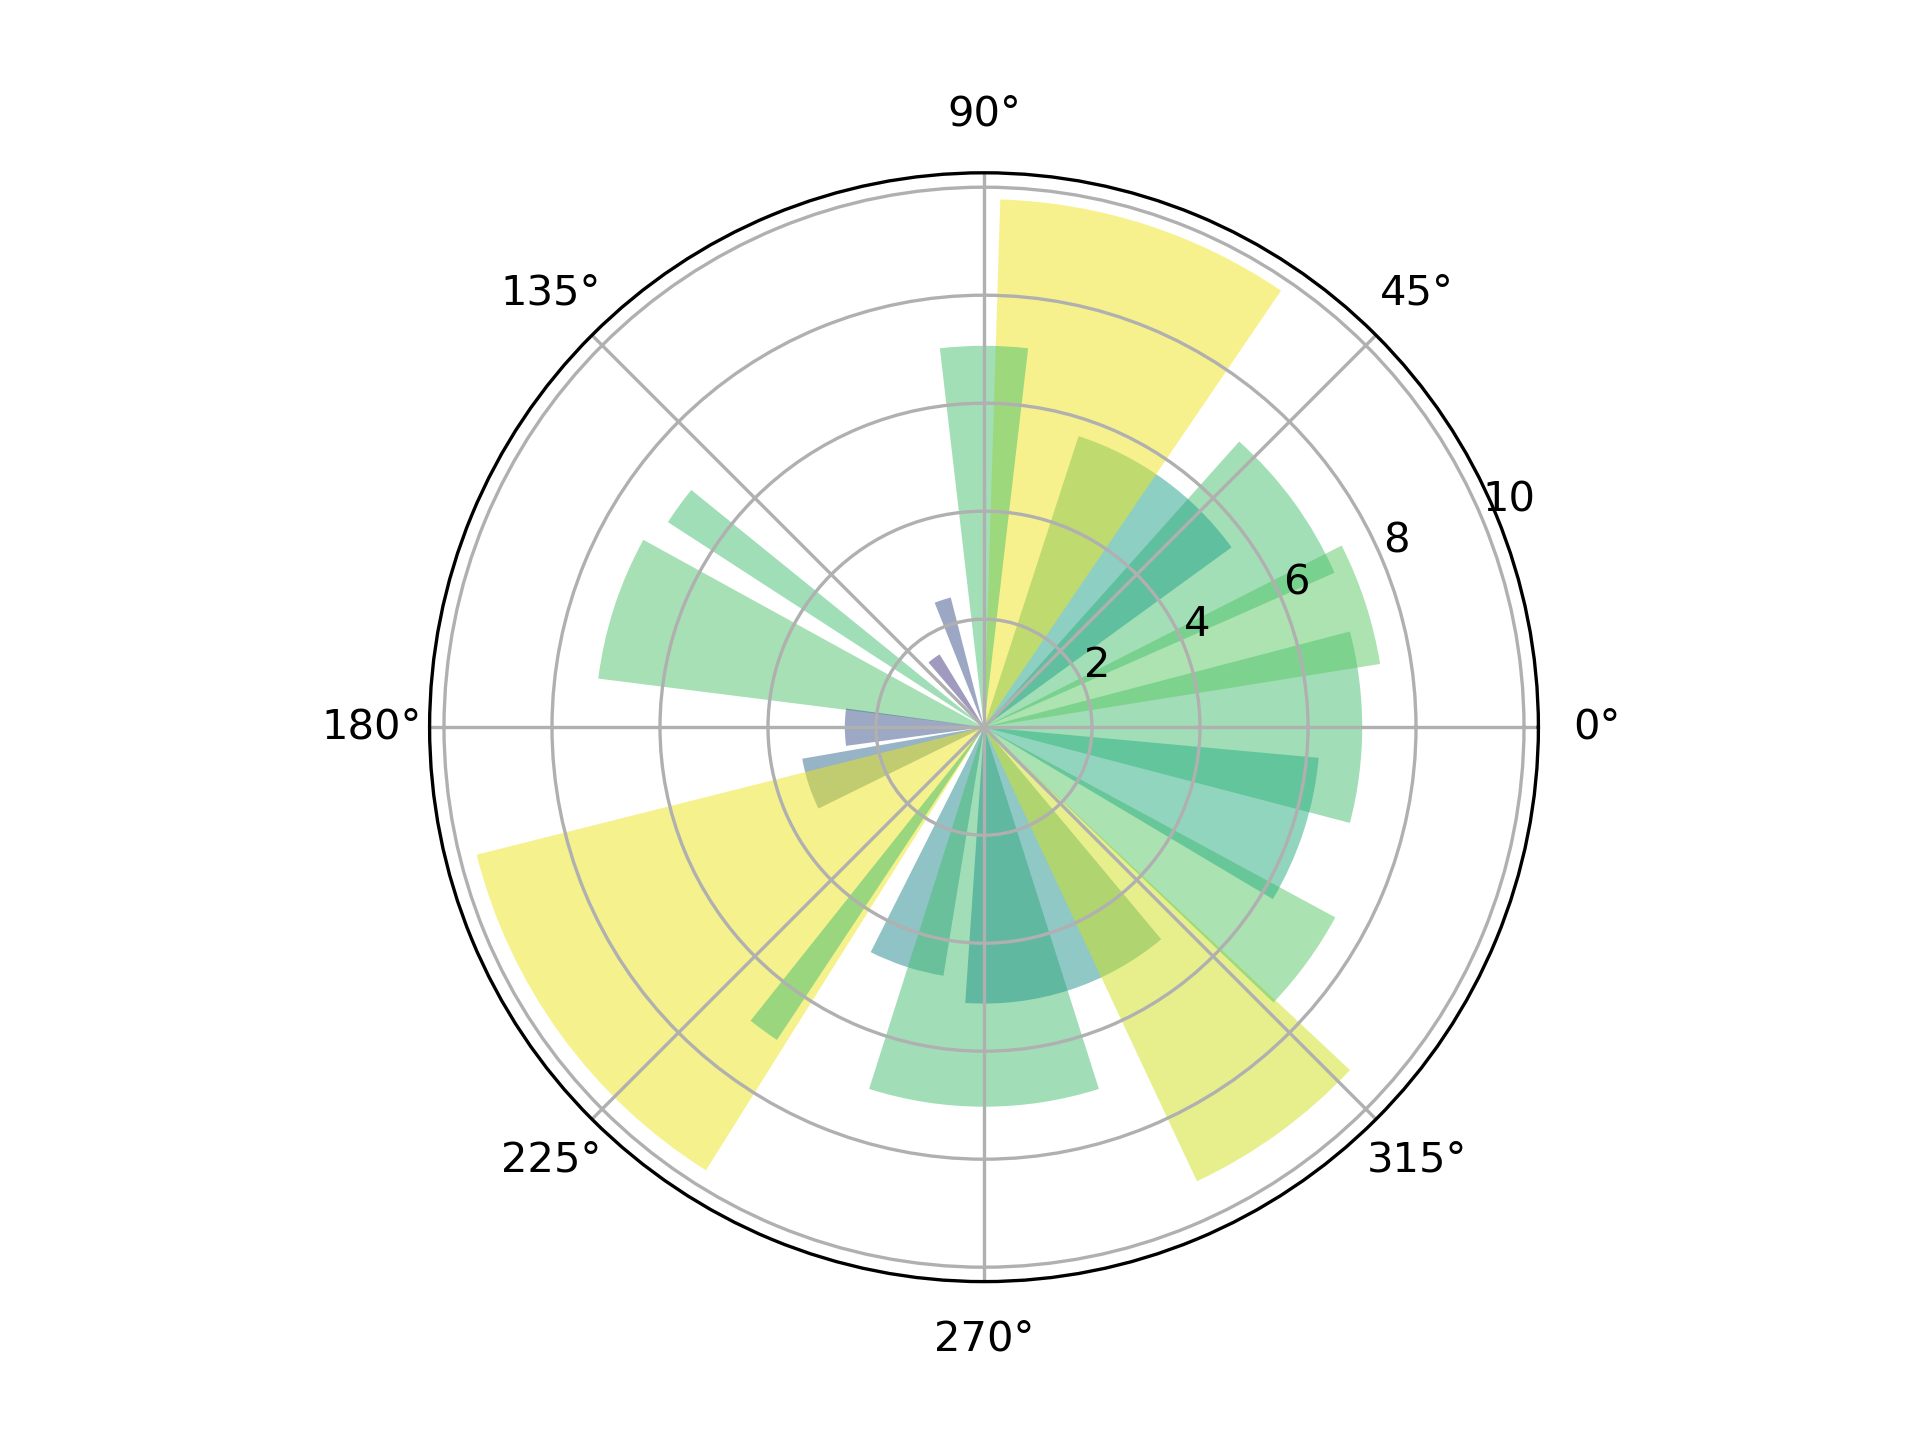
Bar chart on polar axis
=======================
Demo of bar plot on a polar axis.
"""
... import numpy as np
... import matplotlib.pyplot as plt
...
...
... # Fixing random state for reproducibility
... np.random.seed(19680801)
...
... # Compute pie slices
... N = 20
... theta = np.linspace(0.0, 2 * np.pi, N, endpoint=False)
... radii = 10 * np.random.rand(N)
... width = np.pi / 4 * np.random.rand(N)
... colors = plt.cm.viridis(radii / 10.)
...
... ax = plt.subplot(projection='polar')
... ax.bar(theta, radii, width=width, bottom=0.0, color=colors, alpha=0.5)
...
... plt.show()
...
... #############################################################################
... #
... # .. admonition:: References
... #
... # The use of the following functions, methods, classes and modules is shown
... # in this example:
... #
... # - `matplotlib.axes.Axes.bar` / `matplotlib.pyplot.bar`
... # - `matplotlib.projections.polar`
...