>>> """
==========================
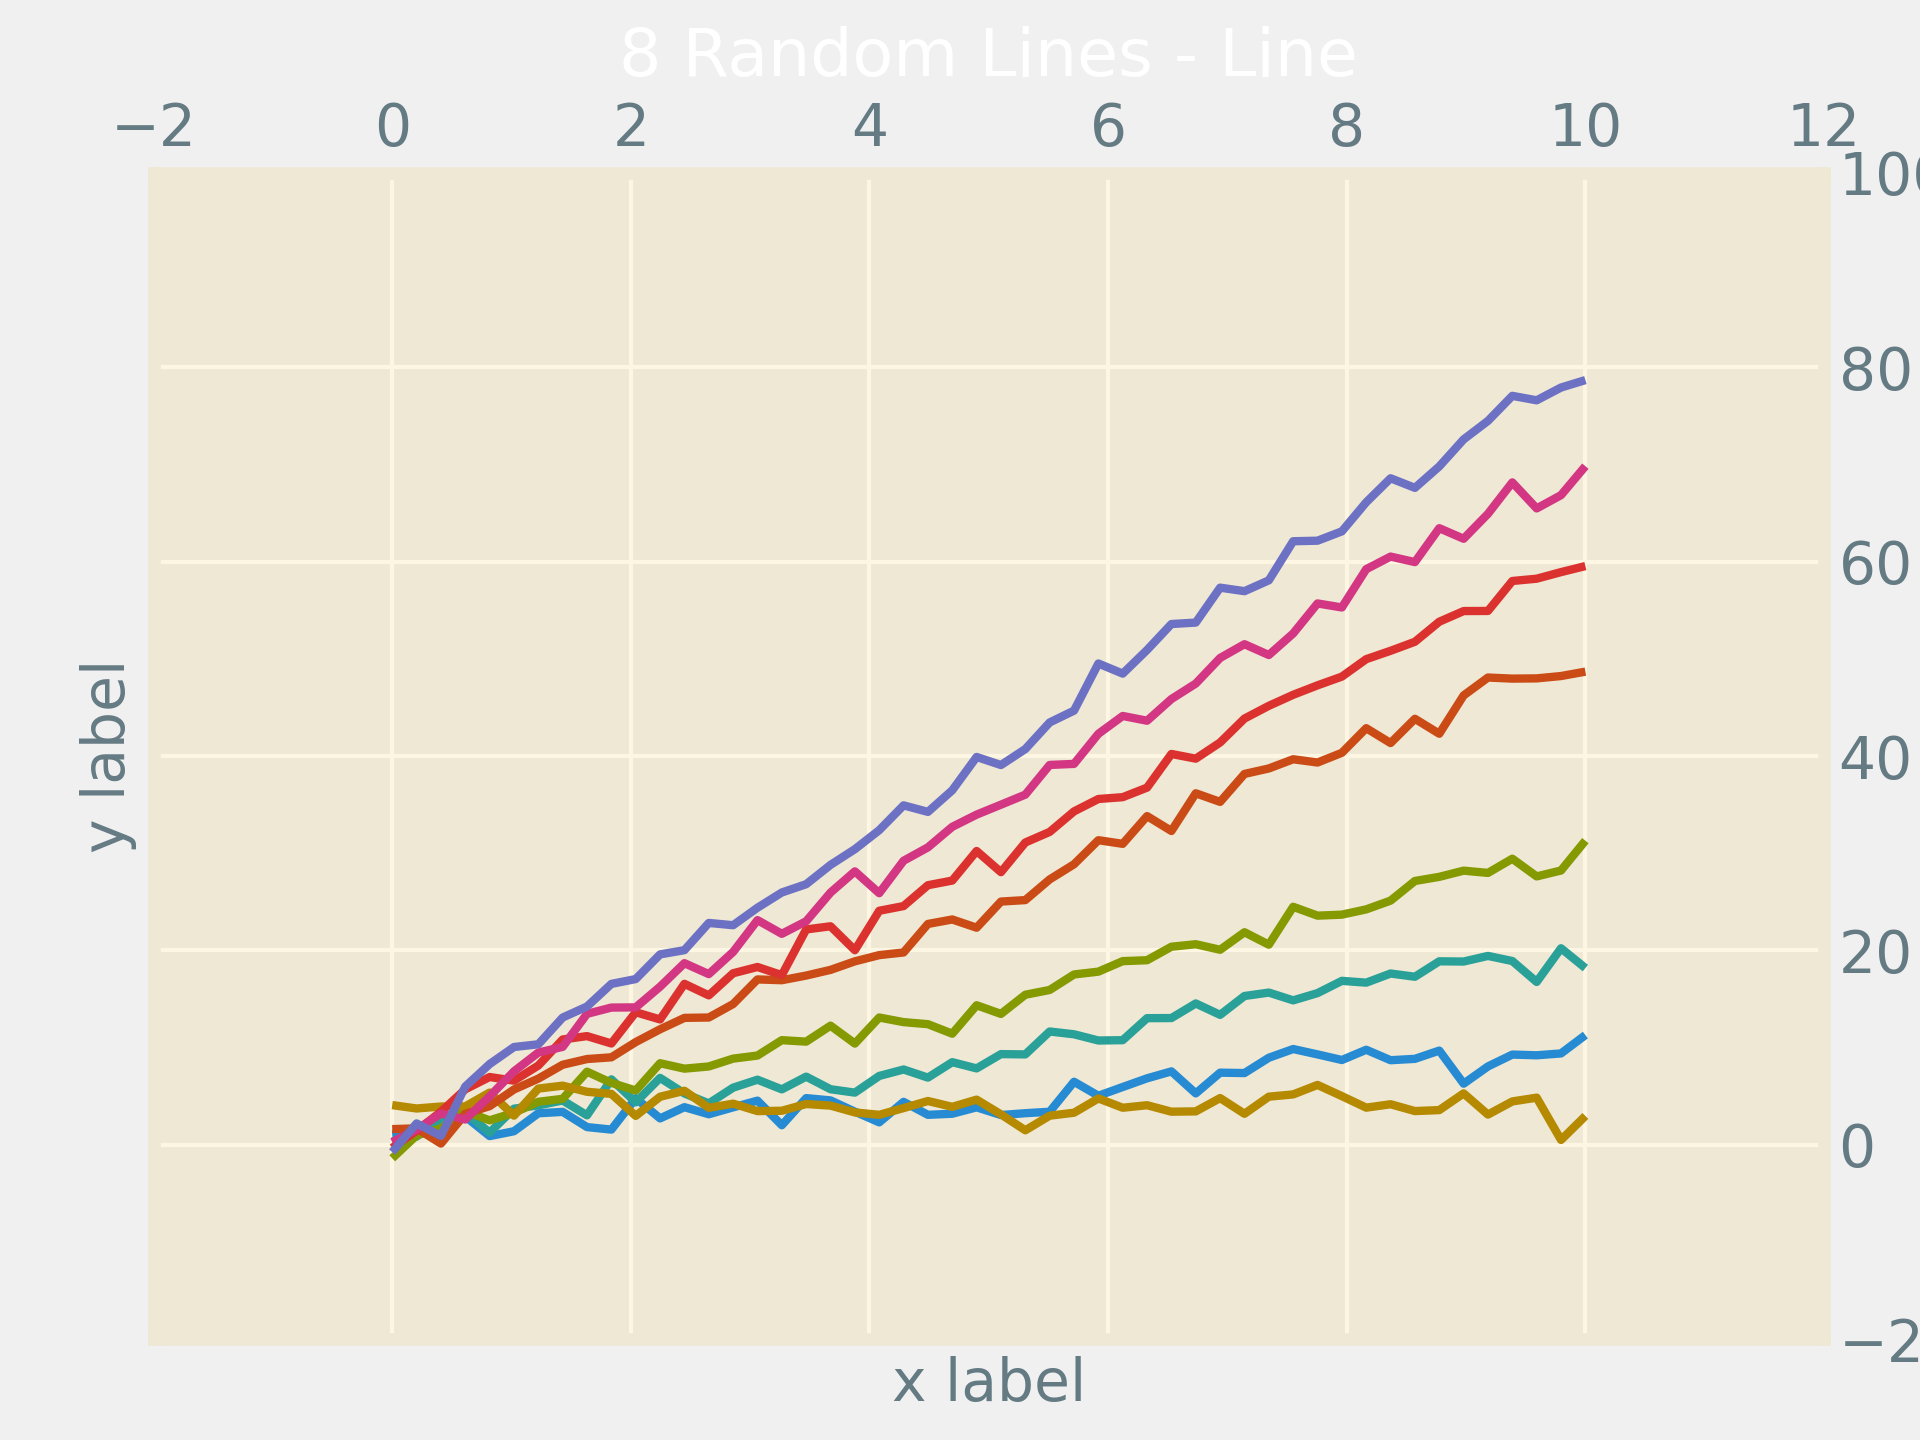
Solarized Light stylesheet
==========================
This shows an example of "Solarized_Light" styling, which
tries to replicate the styles of:
- https://ethanschoonover.com/solarized/
- https://github.com/jrnold/ggthemes
- http://www.pygal.org/en/stable/documentation/builtin_styles.html#light-solarized
and work of:
- https://github.com/tonysyu/mpltools
using all 8 accents of the color palette - starting with blue
Still TODO:
- Create alpha values for bar and stacked charts. .33 or .5
- Apply Layout Rules
"""
... import matplotlib.pyplot as plt
... import numpy as np
...
...
... # Fixing random state for reproducibility
... np.random.seed(19680801)
...
... x = np.linspace(0, 10)
... with plt.style.context('Solarize_Light2'):
... plt.plot(x, np.sin(x) + x + np.random.randn(50))
... plt.plot(x, np.sin(x) + 2 * x + np.random.randn(50))
... plt.plot(x, np.sin(x) + 3 * x + np.random.randn(50))
... plt.plot(x, np.sin(x) + 4 + np.random.randn(50))
... plt.plot(x, np.sin(x) + 5 * x + np.random.randn(50))
... plt.plot(x, np.sin(x) + 6 * x + np.random.randn(50))
... plt.plot(x, np.sin(x) + 7 * x + np.random.randn(50))
... plt.plot(x, np.sin(x) + 8 * x + np.random.randn(50))
... # Number of accent colors in the color scheme
... plt.title('8 Random Lines - Line')
... plt.xlabel('x label', fontsize=14)
... plt.ylabel('y label', fontsize=14)
...
... plt.show()
...