>>> """
==========================
Labeling a pie and a donut
==========================
Welcome to the Matplotlib bakery. We will create a pie and a donut
chart through the `pie method <matplotlib.axes.Axes.pie>` and
show how to label them with a `legend <matplotlib.axes.Axes.legend>`
as well as with `annotations <matplotlib.axes.Axes.annotate>`.
"""
...
... ###############################################################################
... # As usual we would start by defining the imports and create a figure with
... # subplots.
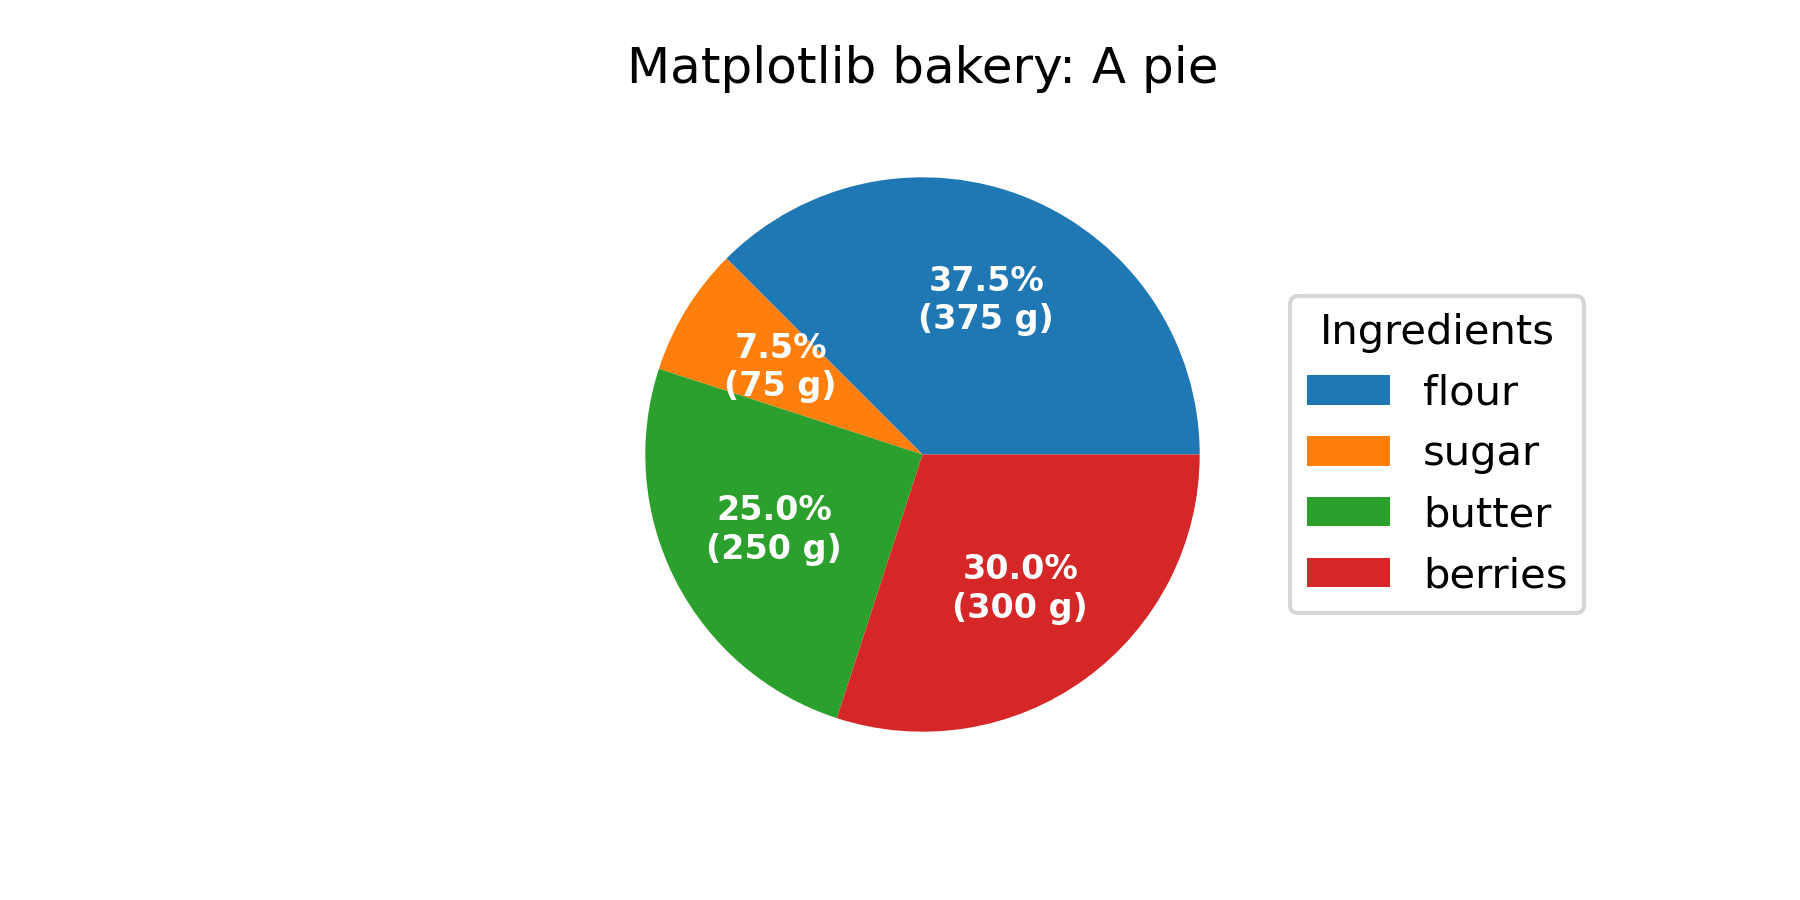
... # Now it's time for the pie. Starting with a pie recipe, we create the data
... # and a list of labels from it.
... #
... # We can provide a function to the ``autopct`` argument, which will expand
... # automatic percentage labeling by showing absolute values; we calculate
... # the latter back from relative data and the known sum of all values.
... #
... # We then create the pie and store the returned objects for later. The first
... # returned element of the returned tuple is a list of the wedges. Those are
... # `matplotlib.patches.Wedge` patches, which can directly be used as the handles
... # for a legend. We can use the legend's ``bbox_to_anchor`` argument to position
... # the legend outside of the pie. Here we use the axes coordinates ``(1, 0, 0.5,
... # 1)`` together with the location ``"center left"``; i.e. the left central
... # point of the legend will be at the left central point of the bounding box,
... # spanning from ``(1, 0)`` to ``(1.5, 1)`` in axes coordinates.
...
... import numpy as np
... import matplotlib.pyplot as plt
...
... fig, ax = plt.subplots(figsize=(6, 3), subplot_kw=dict(aspect="equal"))
...
... recipe = ["375 g flour",
... "75 g sugar",
... "250 g butter",
... "300 g berries"]
...
... data = [float(x.split()[0]) for x in recipe]
... ingredients = [x.split()[-1] for x in recipe]
...
...
... def func(pct, allvals):
... absolute = int(np.round(pct/100.*np.sum(allvals)))
... return "{:.1f}%\n({:d} g)".format(pct, absolute)
...
...
... wedges, texts, autotexts = ax.pie(data, autopct=lambda pct: func(pct, data),
... textprops=dict(color="w"))
...
... ax.legend(wedges, ingredients,
... title="Ingredients",
... loc="center left",
... bbox_to_anchor=(1, 0, 0.5, 1))
...
... plt.setp(autotexts, size=8, weight="bold")
...
... ax.set_title("Matplotlib bakery: A pie")
...
... plt.show()
...
...
... ###############################################################################
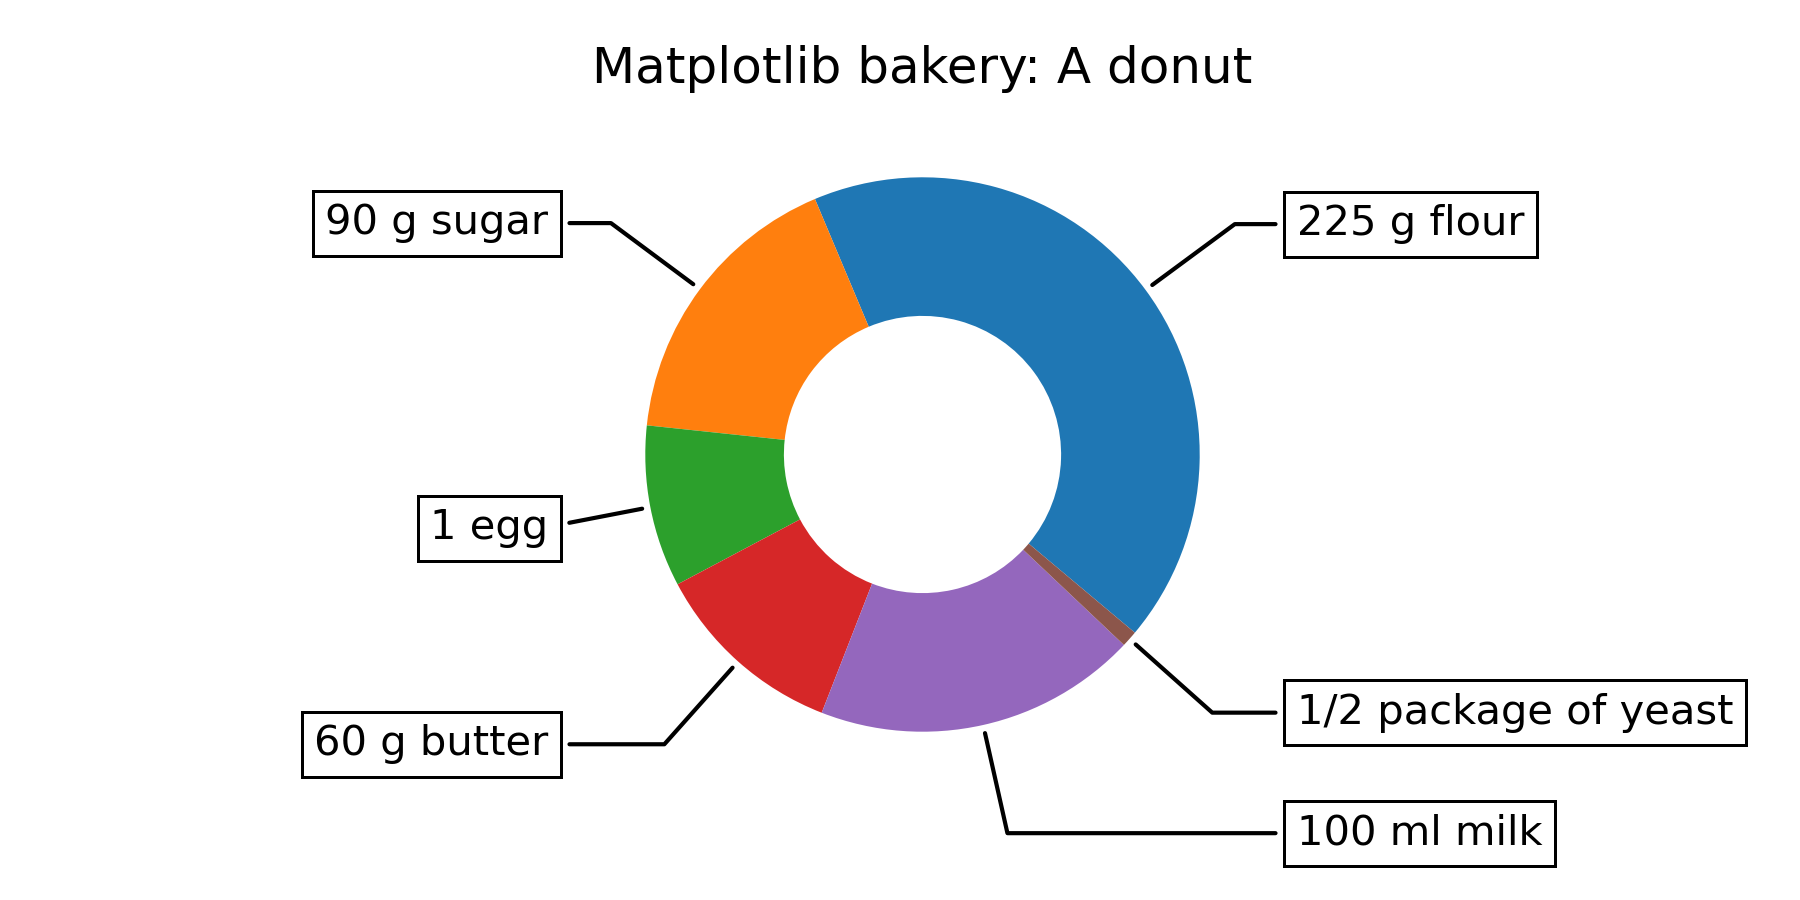
... # Now it's time for the donut. Starting with a donut recipe, we transcribe
... # the data to numbers (converting 1 egg to 50 g), and directly plot the pie.
... # The pie? Wait... it's going to be donut, is it not?
... # Well, as we see here, the donut is a pie, having a certain ``width`` set to
... # the wedges, which is different from its radius. It's as easy as it gets.
... # This is done via the ``wedgeprops`` argument.
... #
... # We then want to label the wedges via
... # `annotations <matplotlib.axes.Axes.annotate>`. We first create some
... # dictionaries of common properties, which we can later pass as keyword
... # argument. We then iterate over all wedges and for each
... #
... # * calculate the angle of the wedge's center,
... # * from that obtain the coordinates of the point at that angle on the
... # circumference,
... # * determine the horizontal alignment of the text, depending on which side
... # of the circle the point lies,
... # * update the connection style with the obtained angle to have the annotation
... # arrow point outwards from the donut,
... # * finally, create the annotation with all the previously
... # determined parameters.
...
...
... fig, ax = plt.subplots(figsize=(6, 3), subplot_kw=dict(aspect="equal"))
...
... recipe = ["225 g flour",
... "90 g sugar",
... "1 egg",
... "60 g butter",
... "100 ml milk",
... "1/2 package of yeast"]
...
... data = [225, 90, 50, 60, 100, 5]
...
... wedges, texts = ax.pie(data, wedgeprops=dict(width=0.5), startangle=-40)
...
... bbox_props = dict(boxstyle="square,pad=0.3", fc="w", ec="k", lw=0.72)
... kw = dict(arrowprops=dict(arrowstyle="-"),
... bbox=bbox_props, zorder=0, va="center")
...
... for i, p in enumerate(wedges):
... ang = (p.theta2 - p.theta1)/2. + p.theta1
... y = np.sin(np.deg2rad(ang))
... x = np.cos(np.deg2rad(ang))
... horizontalalignment = {-1: "right", 1: "left"}[int(np.sign(x))]
... connectionstyle = "angle,angleA=0,angleB={}".format(ang)
... kw["arrowprops"].update({"connectionstyle": connectionstyle})
... ax.annotate(recipe[i], xy=(x, y), xytext=(1.35*np.sign(x), 1.4*y),
... horizontalalignment=horizontalalignment, **kw)
...
... ax.set_title("Matplotlib bakery: A donut")
...
... plt.show()
...
... ###############################################################################
... # And here it is, the donut. Note however, that if we were to use this recipe,
... # the ingredients would suffice for around 6 donuts - producing one huge
... # donut is untested and might result in kitchen errors.
...
...
... #############################################################################
... #
... # .. admonition:: References
... #
... # The use of the following functions, methods, classes and modules is shown
... # in this example:
... #
... # - `matplotlib.axes.Axes.pie` / `matplotlib.pyplot.pie`
... # - `matplotlib.axes.Axes.legend` / `matplotlib.pyplot.legend`
...