>>> """
================
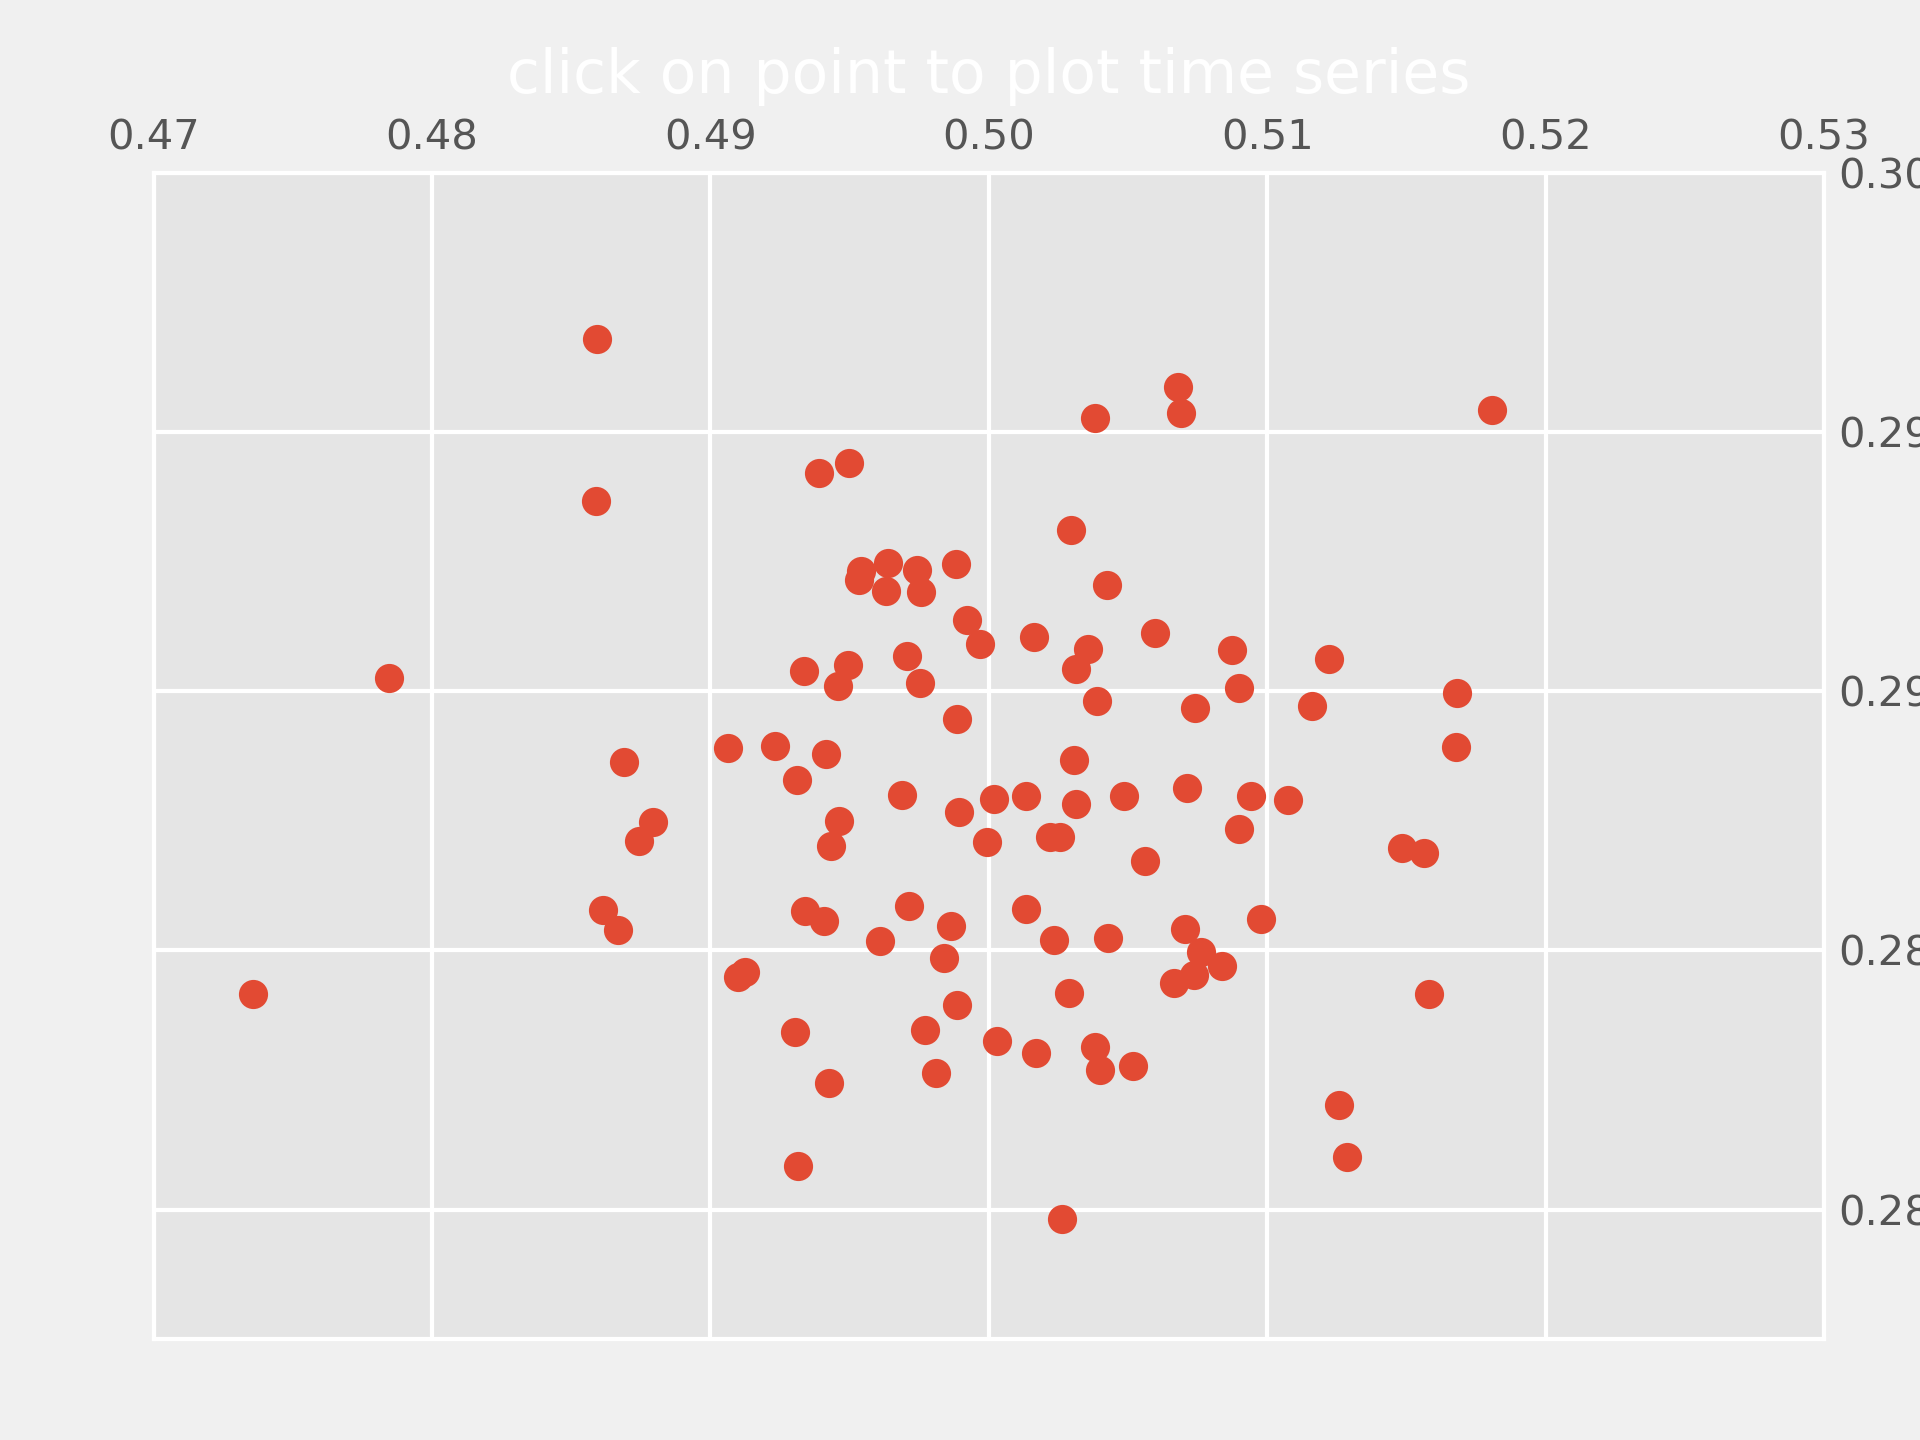
Pick Event Demo2
================
Compute the mean (mu) and standard deviation (sigma) of 100 data sets and plot
mu vs. sigma. When you click on one of the (mu, sigma) points, plot the raw
data from the dataset that generated this point.
"""
... import numpy as np
... import matplotlib.pyplot as plt
...
...
... # Fixing random state for reproducibility
... np.random.seed(19680801)
...
... X = np.random.rand(100, 1000)
... xs = np.mean(X, axis=1)
... ys = np.std(X, axis=1)
...
... fig, ax = plt.subplots()
... ax.set_title('click on point to plot time series')
... line, = ax.plot(xs, ys, 'o', picker=True, pickradius=5)
...
...
... def onpick(event):
...
... if event.artist != line:
... return True
...
... N = len(event.ind)
... if not N:
... return True
...
... figi, axs = plt.subplots(N, squeeze=False)
... for ax, dataind in zip(axs.flat, event.ind):
... ax.plot(X[dataind])
... ax.text(.05, .9, 'mu=%1.3f\nsigma=%1.3f' % (xs[dataind], ys[dataind]),
... transform=ax.transAxes, va='top')
... ax.set_ylim(-0.5, 1.5)
... figi.show()
... return True
...
... fig.canvas.mpl_connect('pick_event', onpick)
...
... plt.show()
...