>>> """
============================
pcolormesh grids and shading
============================
`.axes.Axes.pcolormesh` and `~.axes.Axes.pcolor` have a few options for
how grids are laid out and the shading between the grid points.
Generally, if *Z* has shape *(M, N)* then the grid *X* and *Y* can be
specified with either shape *(M+1, N+1)* or *(M, N)*, depending on the
argument for the ``shading`` keyword argument. Note that below we specify
vectors *x* as either length N or N+1 and *y* as length M or M+1, and
`~.axes.Axes.pcolormesh` internally makes the mesh matrices *X* and *Y* from
the input vectors.
"""
...
... import matplotlib.pyplot as plt
... import numpy as np
...
... ###############################################################################
... # Flat Shading
... # ------------
... #
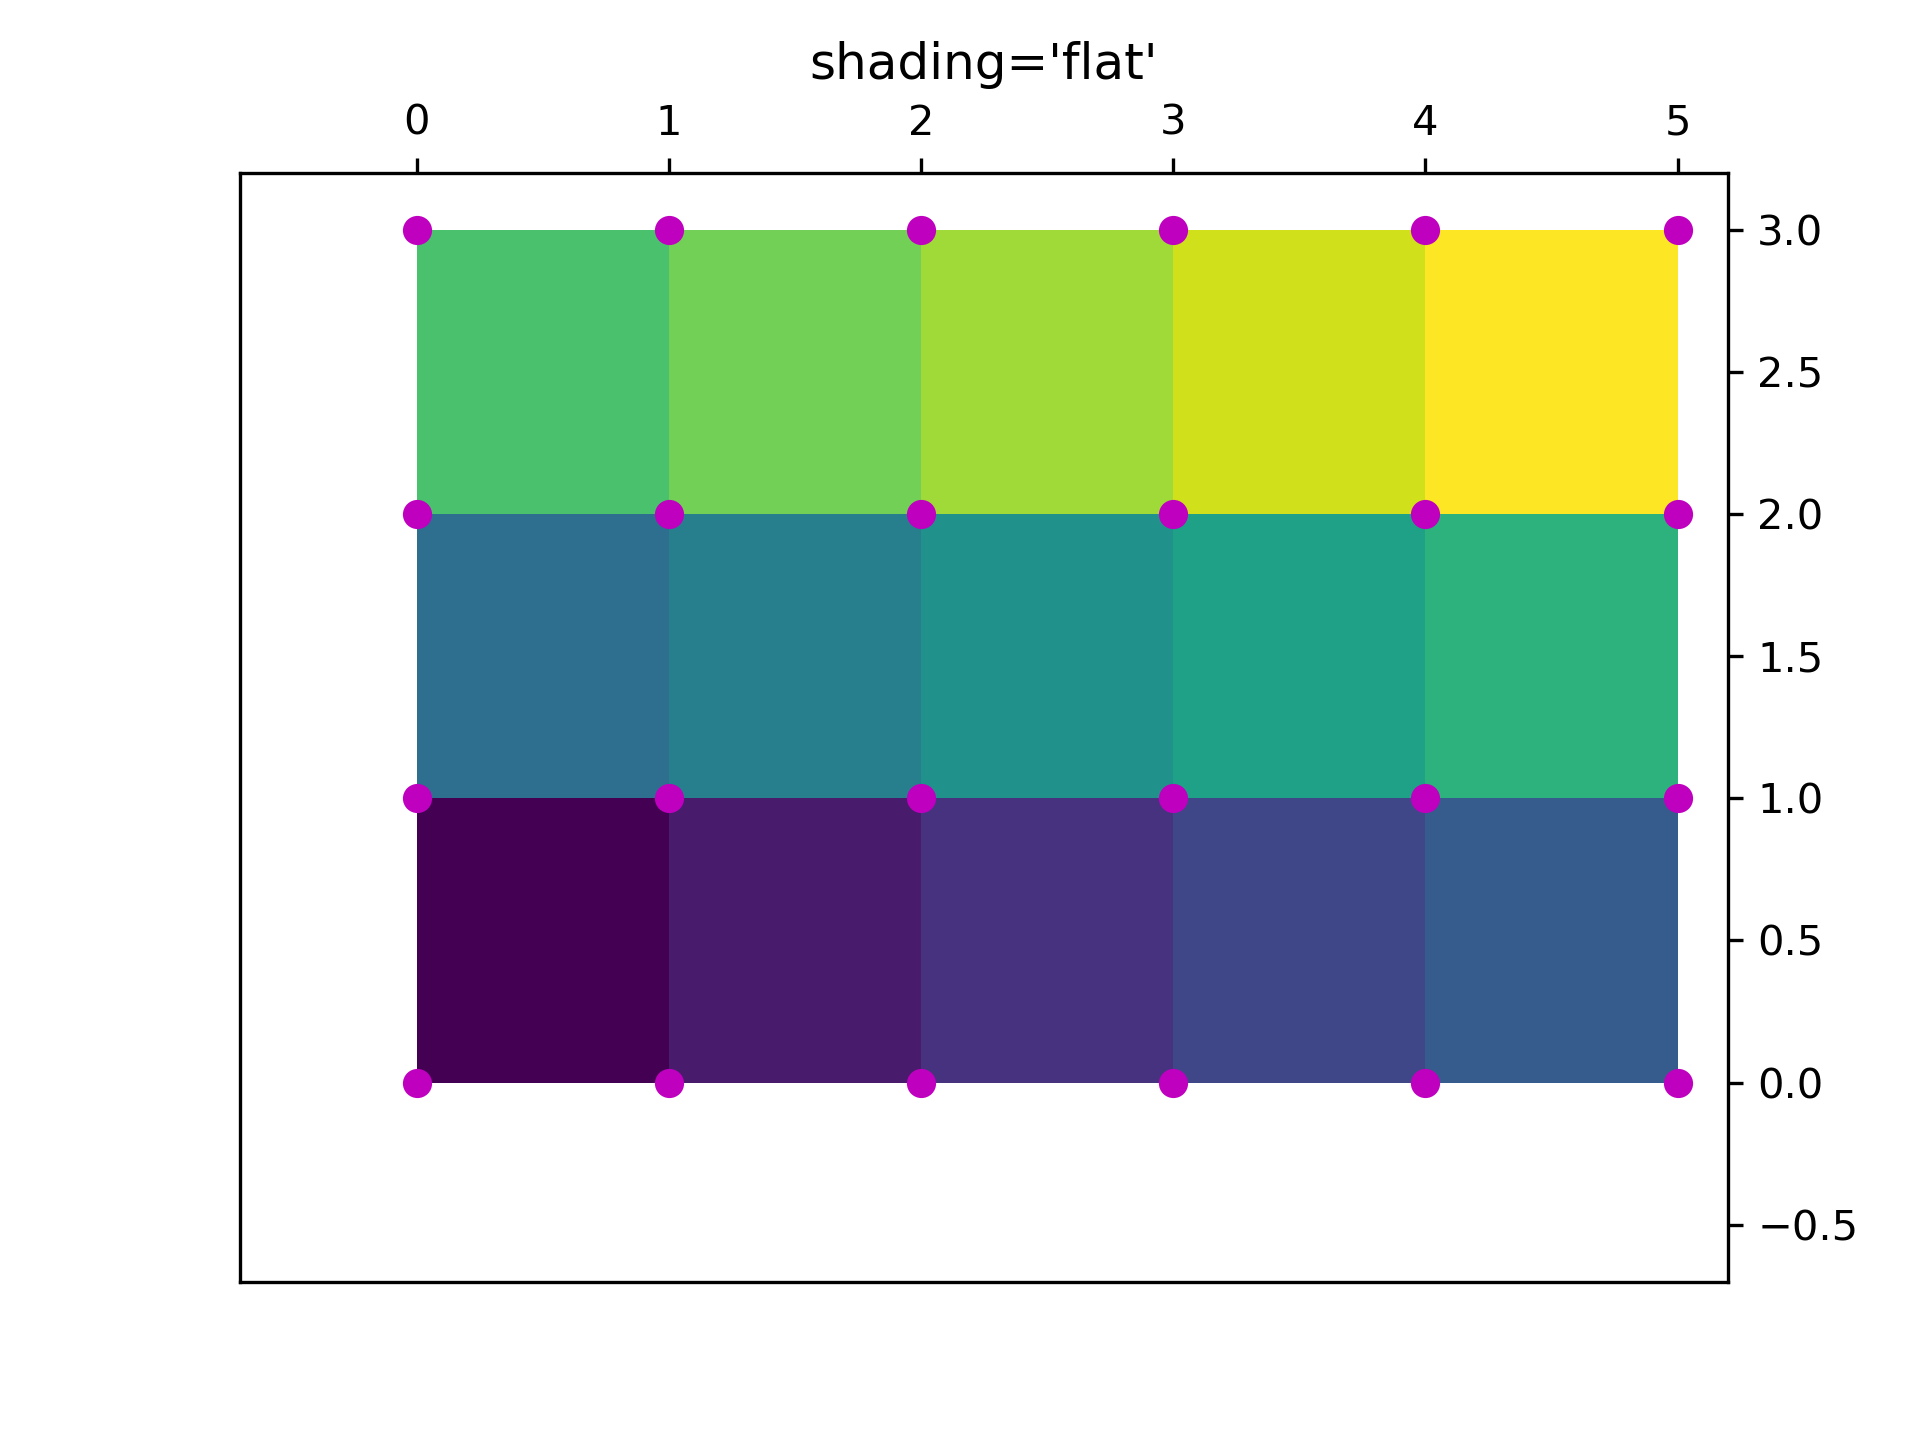
... # The grid specification with the least assumptions is ``shading='flat'``
... # and if the grid is one larger than the data in each dimension, i.e. has shape
... # *(M+1, N+1)*. In that case *X* and *Y* specify the corners of quadrilaterals
... # that are colored with the values in *Z*. Here we specify the edges of the
... # *(3, 5)* quadrilaterals with *X* and *Y* that are *(4, 6)*.
...
... nrows = 3
... ncols = 5
... Z = np.arange(nrows * ncols).reshape(nrows, ncols)
... x = np.arange(ncols + 1)
... y = np.arange(nrows + 1)
...
... fig, ax = plt.subplots()
... ax.pcolormesh(x, y, Z, shading='flat', vmin=Z.min(), vmax=Z.max())
...
...
... def _annotate(ax, x, y, title):
... # this all gets repeated below:
... X, Y = np.meshgrid(x, y)
... ax.plot(X.flat, Y.flat, 'o', color='m')
... ax.set_xlim(-0.7, 5.2)
... ax.set_ylim(-0.7, 3.2)
... ax.set_title(title)
...
... _annotate(ax, x, y, "shading='flat'")
...
...
... ###############################################################################
... # Flat Shading, same shape grid
... # -----------------------------
... #
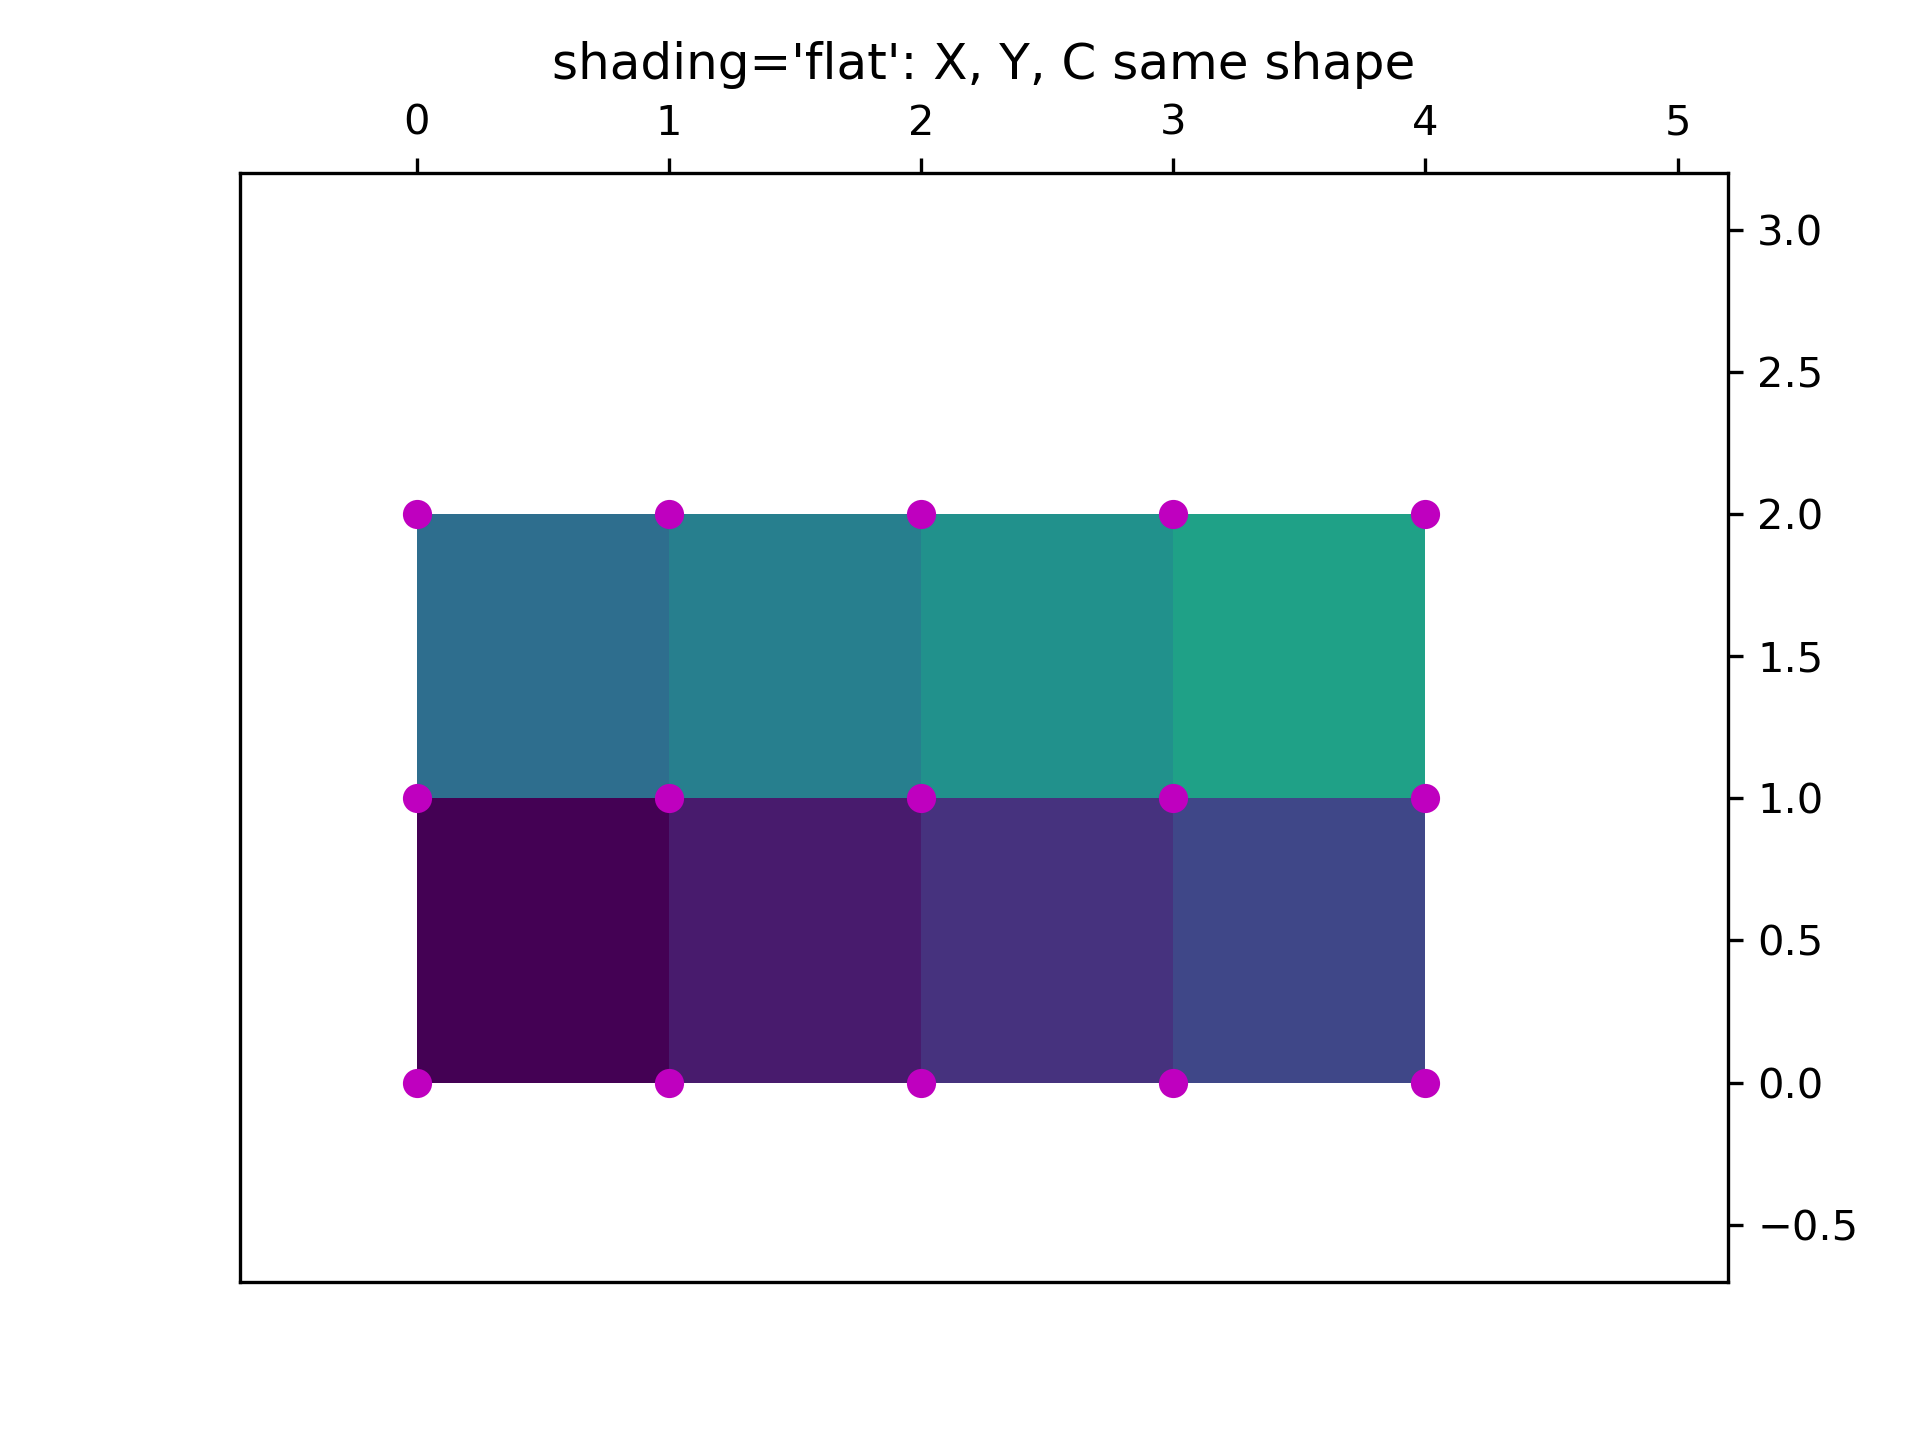
... # Often, however, data is provided where *X* and *Y* match the shape of *Z*.
... # While this makes sense for other ``shading`` types, it is no longer permitted
... # when ``shading='flat'`` (and will raise a MatplotlibDeprecationWarning as of
... # Matplotlib v3.3). Historically, Matplotlib silently dropped the last row and
... # column of *Z* in this case, to match Matlab's behavior. If this behavior is
... # still desired, simply drop the last row and column manually:
...
... x = np.arange(ncols) # note *not* ncols + 1 as before
... y = np.arange(nrows)
... fig, ax = plt.subplots()
... ax.pcolormesh(x, y, Z[:-1, :-1], shading='flat', vmin=Z.min(), vmax=Z.max())
... _annotate(ax, x, y, "shading='flat': X, Y, C same shape")
...
... ###############################################################################
... # Nearest Shading, same shape grid
... # --------------------------------
... #
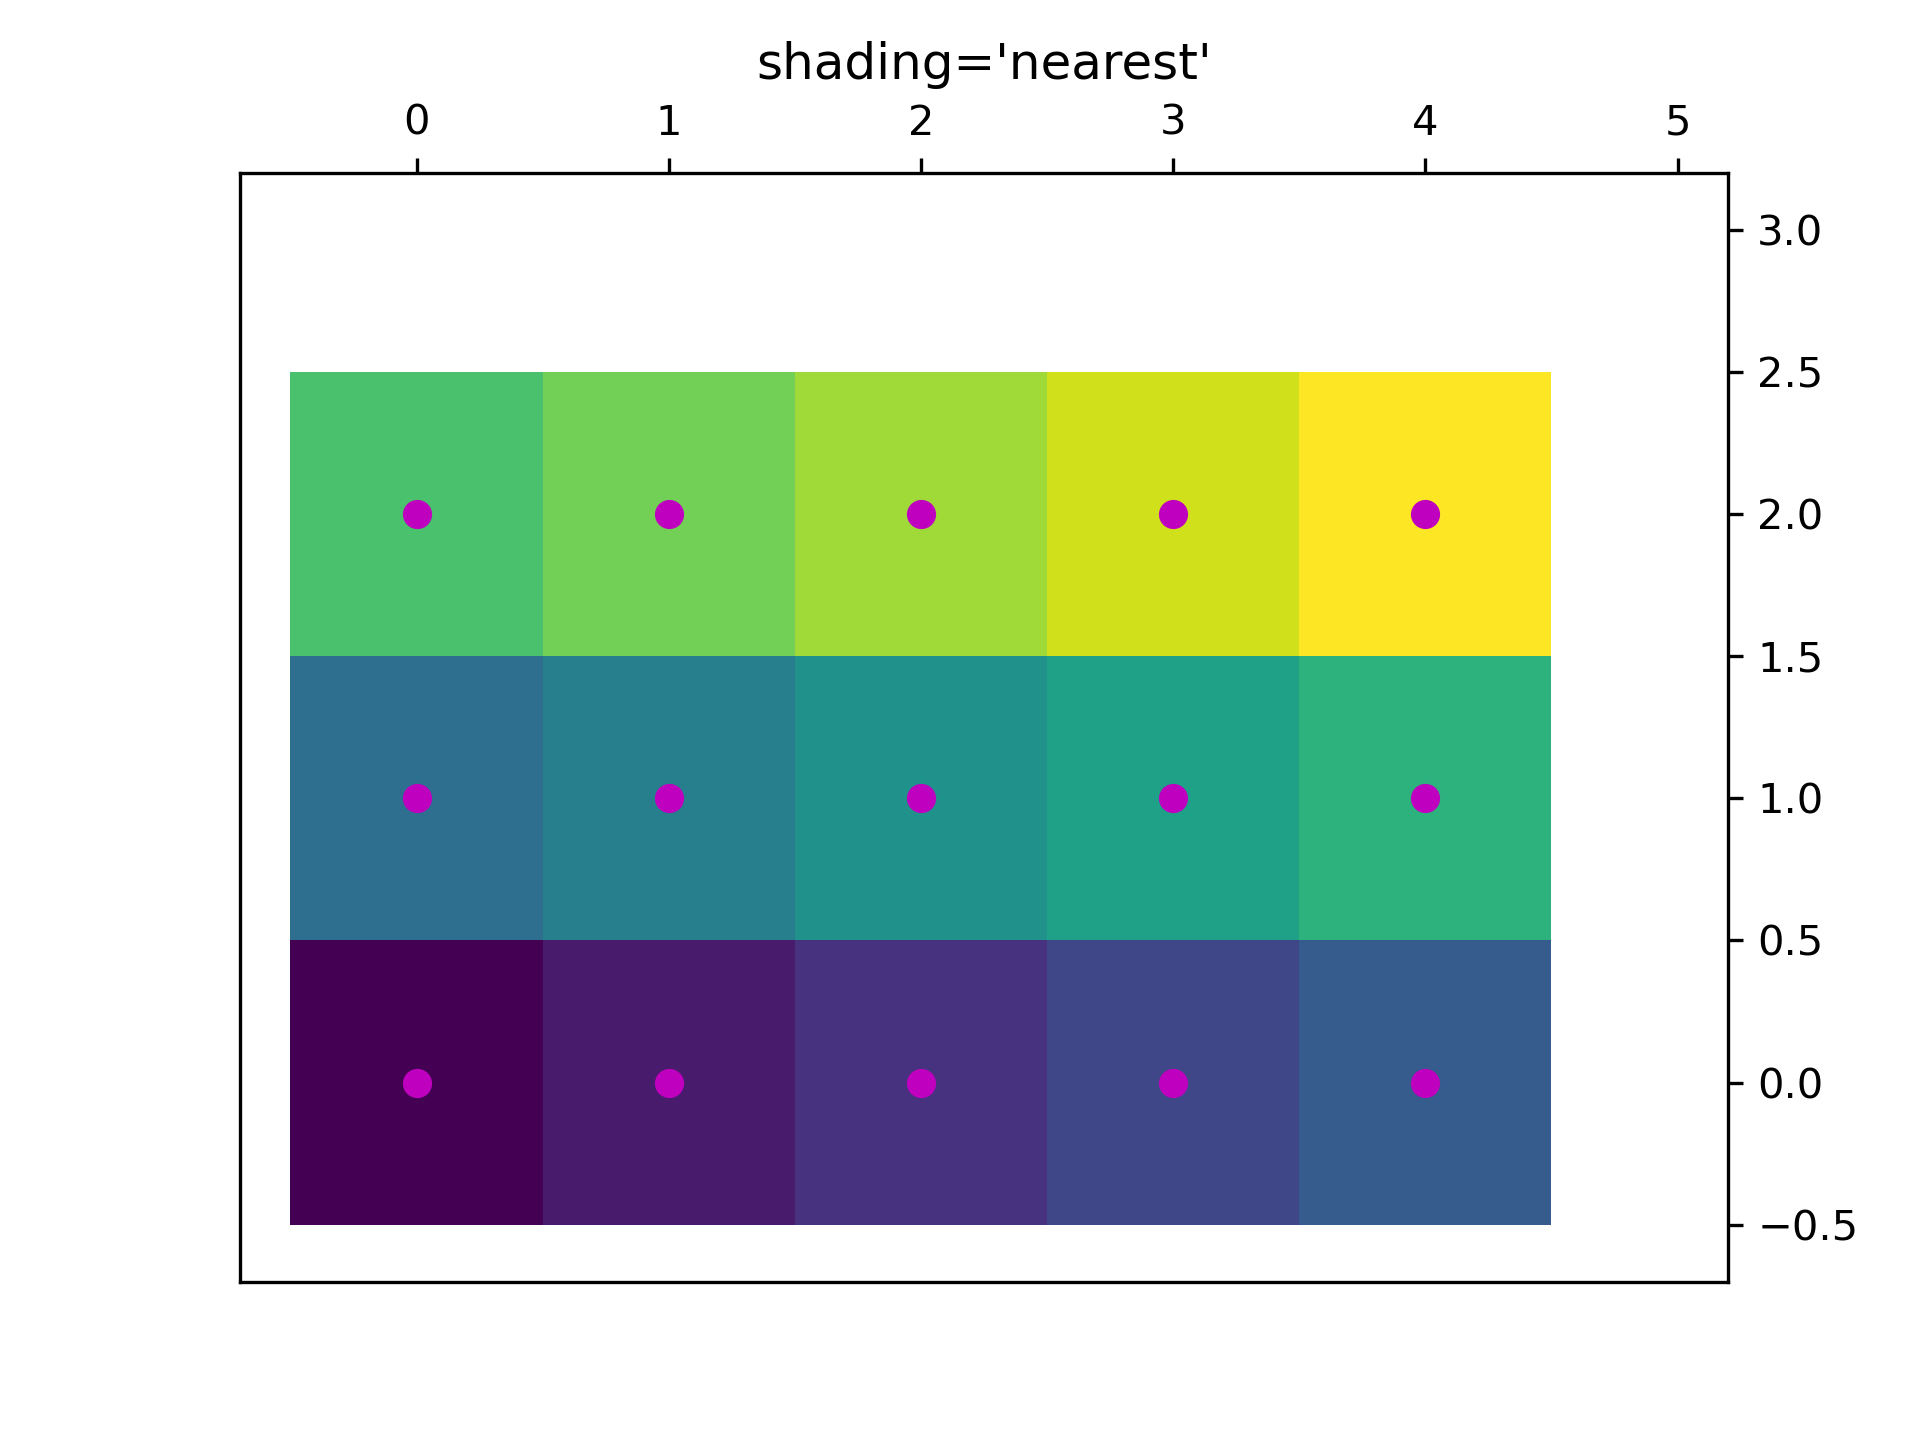
... # Usually, dropping a row and column of data is not what the user means when
... # they make *X*, *Y* and *Z* all the same shape. For this case, Matplotlib
... # allows ``shading='nearest'`` and centers the colored quadrilaterals on the
... # grid points.
... #
... # If a grid that is not the correct shape is passed with ``shading='nearest'``
... # an error is raised.
...
... fig, ax = plt.subplots()
... ax.pcolormesh(x, y, Z, shading='nearest', vmin=Z.min(), vmax=Z.max())
... _annotate(ax, x, y, "shading='nearest'")
...
... ###############################################################################
... # Auto Shading
... # ------------
... #
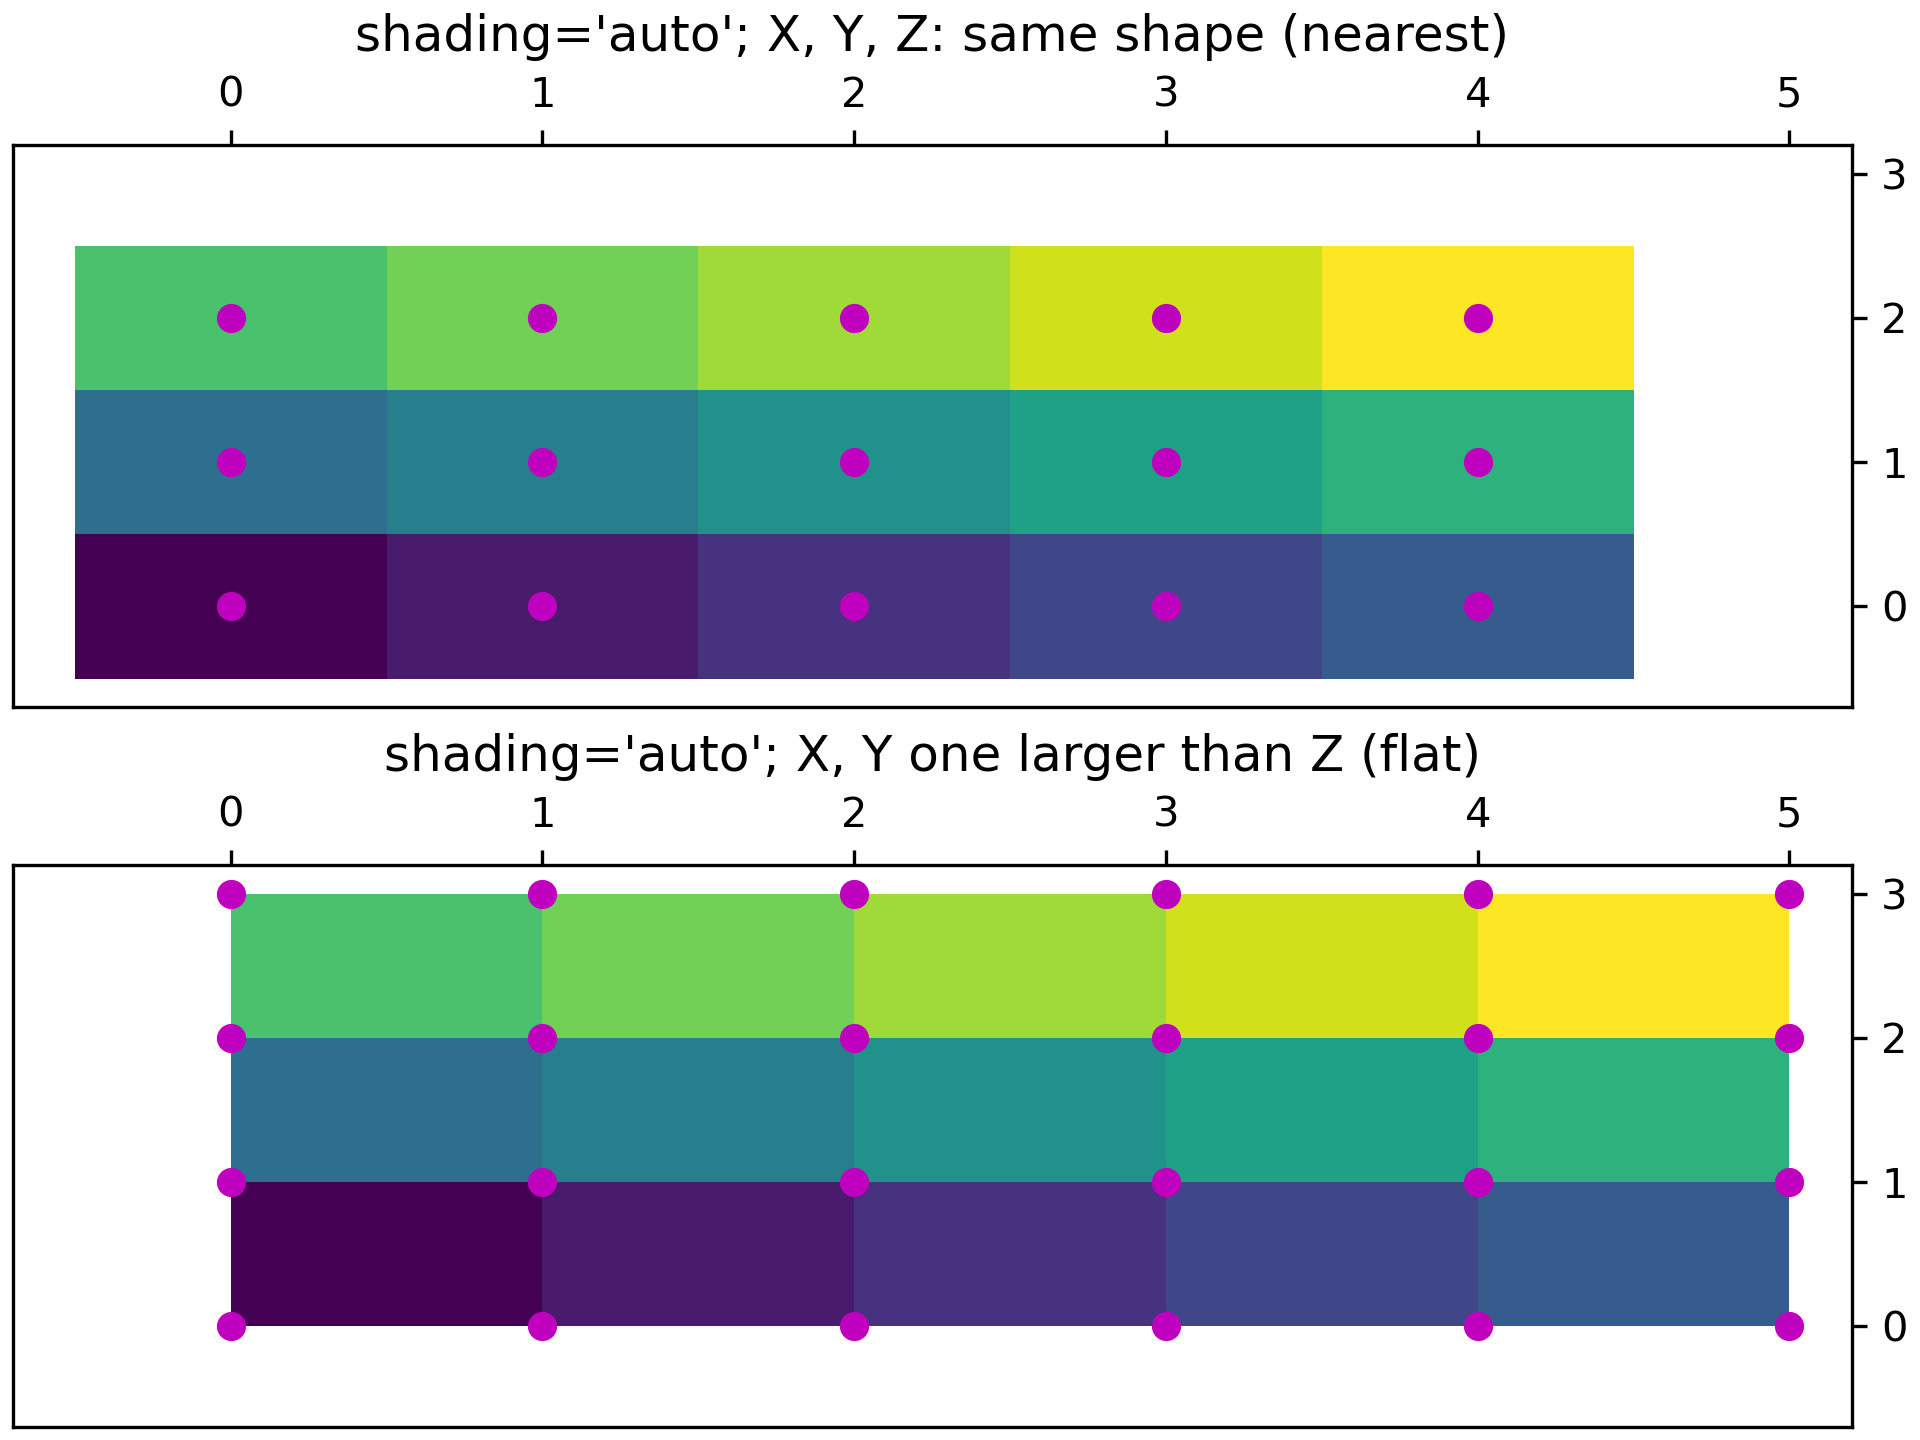
... # It's possible that the user would like the code to automatically choose which
... # to use, in this case ``shading='auto'`` will decide whether to use 'flat' or
... # 'nearest' shading based on the shapes of *X*, *Y* and *Z*.
...
... fig, axs = plt.subplots(2, 1, constrained_layout=True)
... ax = axs[0]
... x = np.arange(ncols)
... y = np.arange(nrows)
... ax.pcolormesh(x, y, Z, shading='auto', vmin=Z.min(), vmax=Z.max())
... _annotate(ax, x, y, "shading='auto'; X, Y, Z: same shape (nearest)")
...
... ax = axs[1]
... x = np.arange(ncols + 1)
... y = np.arange(nrows + 1)
... ax.pcolormesh(x, y, Z, shading='auto', vmin=Z.min(), vmax=Z.max())
... _annotate(ax, x, y, "shading='auto'; X, Y one larger than Z (flat)")
...
... ###############################################################################
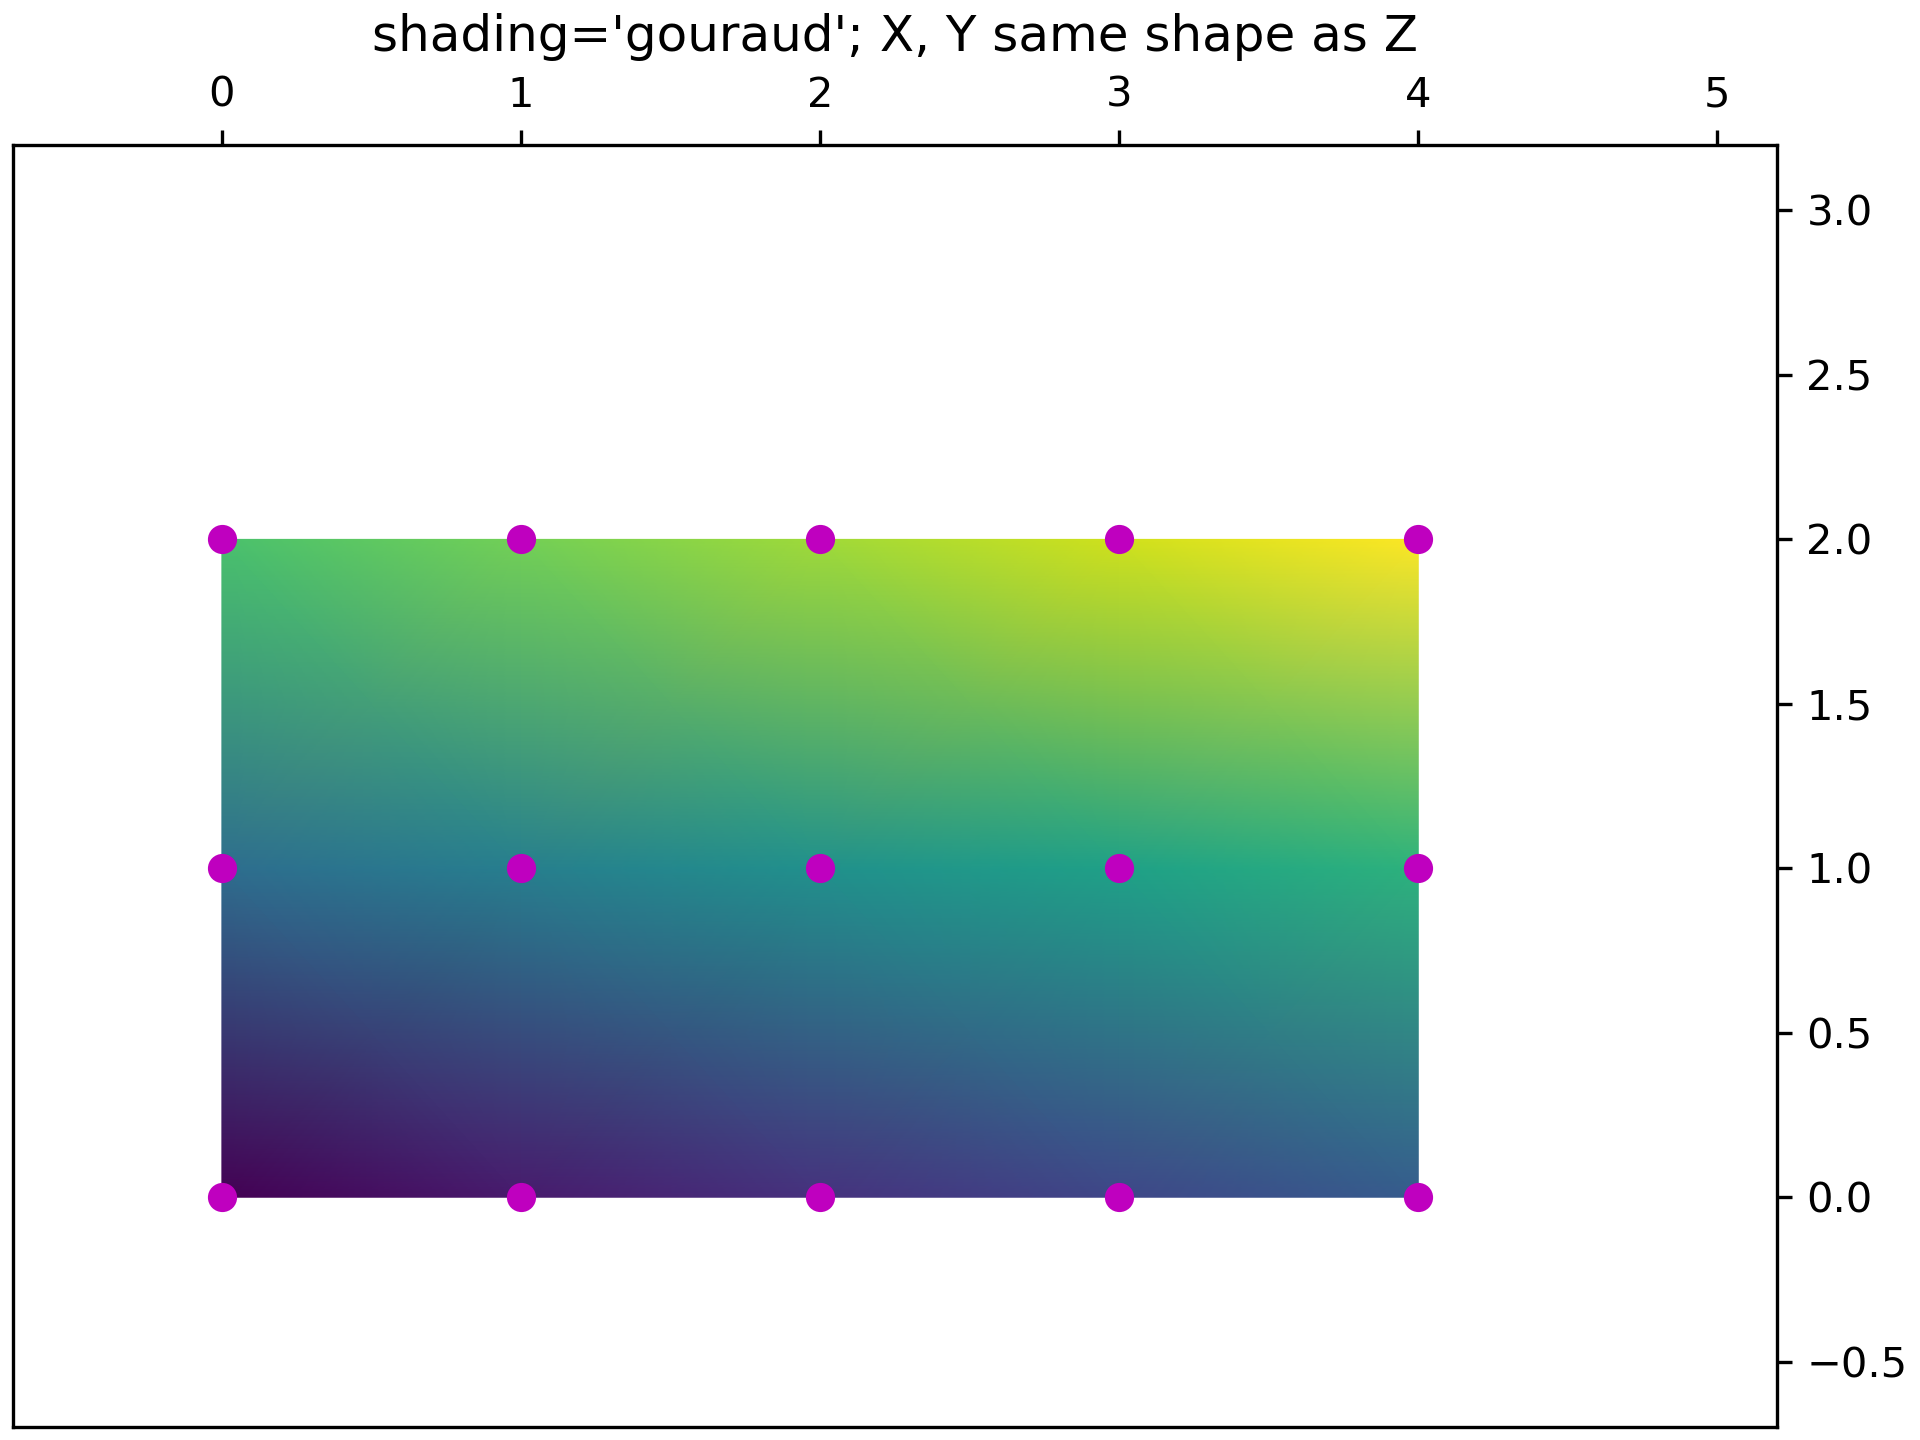
... # Gouraud Shading
... # ---------------
... #
... # `Gouraud shading <https://en.wikipedia.org/wiki/Gouraud_shading>`_ can also
... # be specified, where the color in the quadrilaterals is linearly interpolated
... # between the grid points. The shapes of *X*, *Y*, *Z* must be the same.
...
... fig, ax = plt.subplots(constrained_layout=True)
... x = np.arange(ncols)
... y = np.arange(nrows)
... ax.pcolormesh(x, y, Z, shading='gouraud', vmin=Z.min(), vmax=Z.max())
... _annotate(ax, x, y, "shading='gouraud'; X, Y same shape as Z")
...
... plt.show()
... #############################################################################
... #
... # .. admonition:: References
... #
... # The use of the following functions, methods, classes and modules is shown
... # in this example:
... #
... # - `matplotlib.axes.Axes.pcolormesh` / `matplotlib.pyplot.pcolormesh`
...