>>> r"""
================
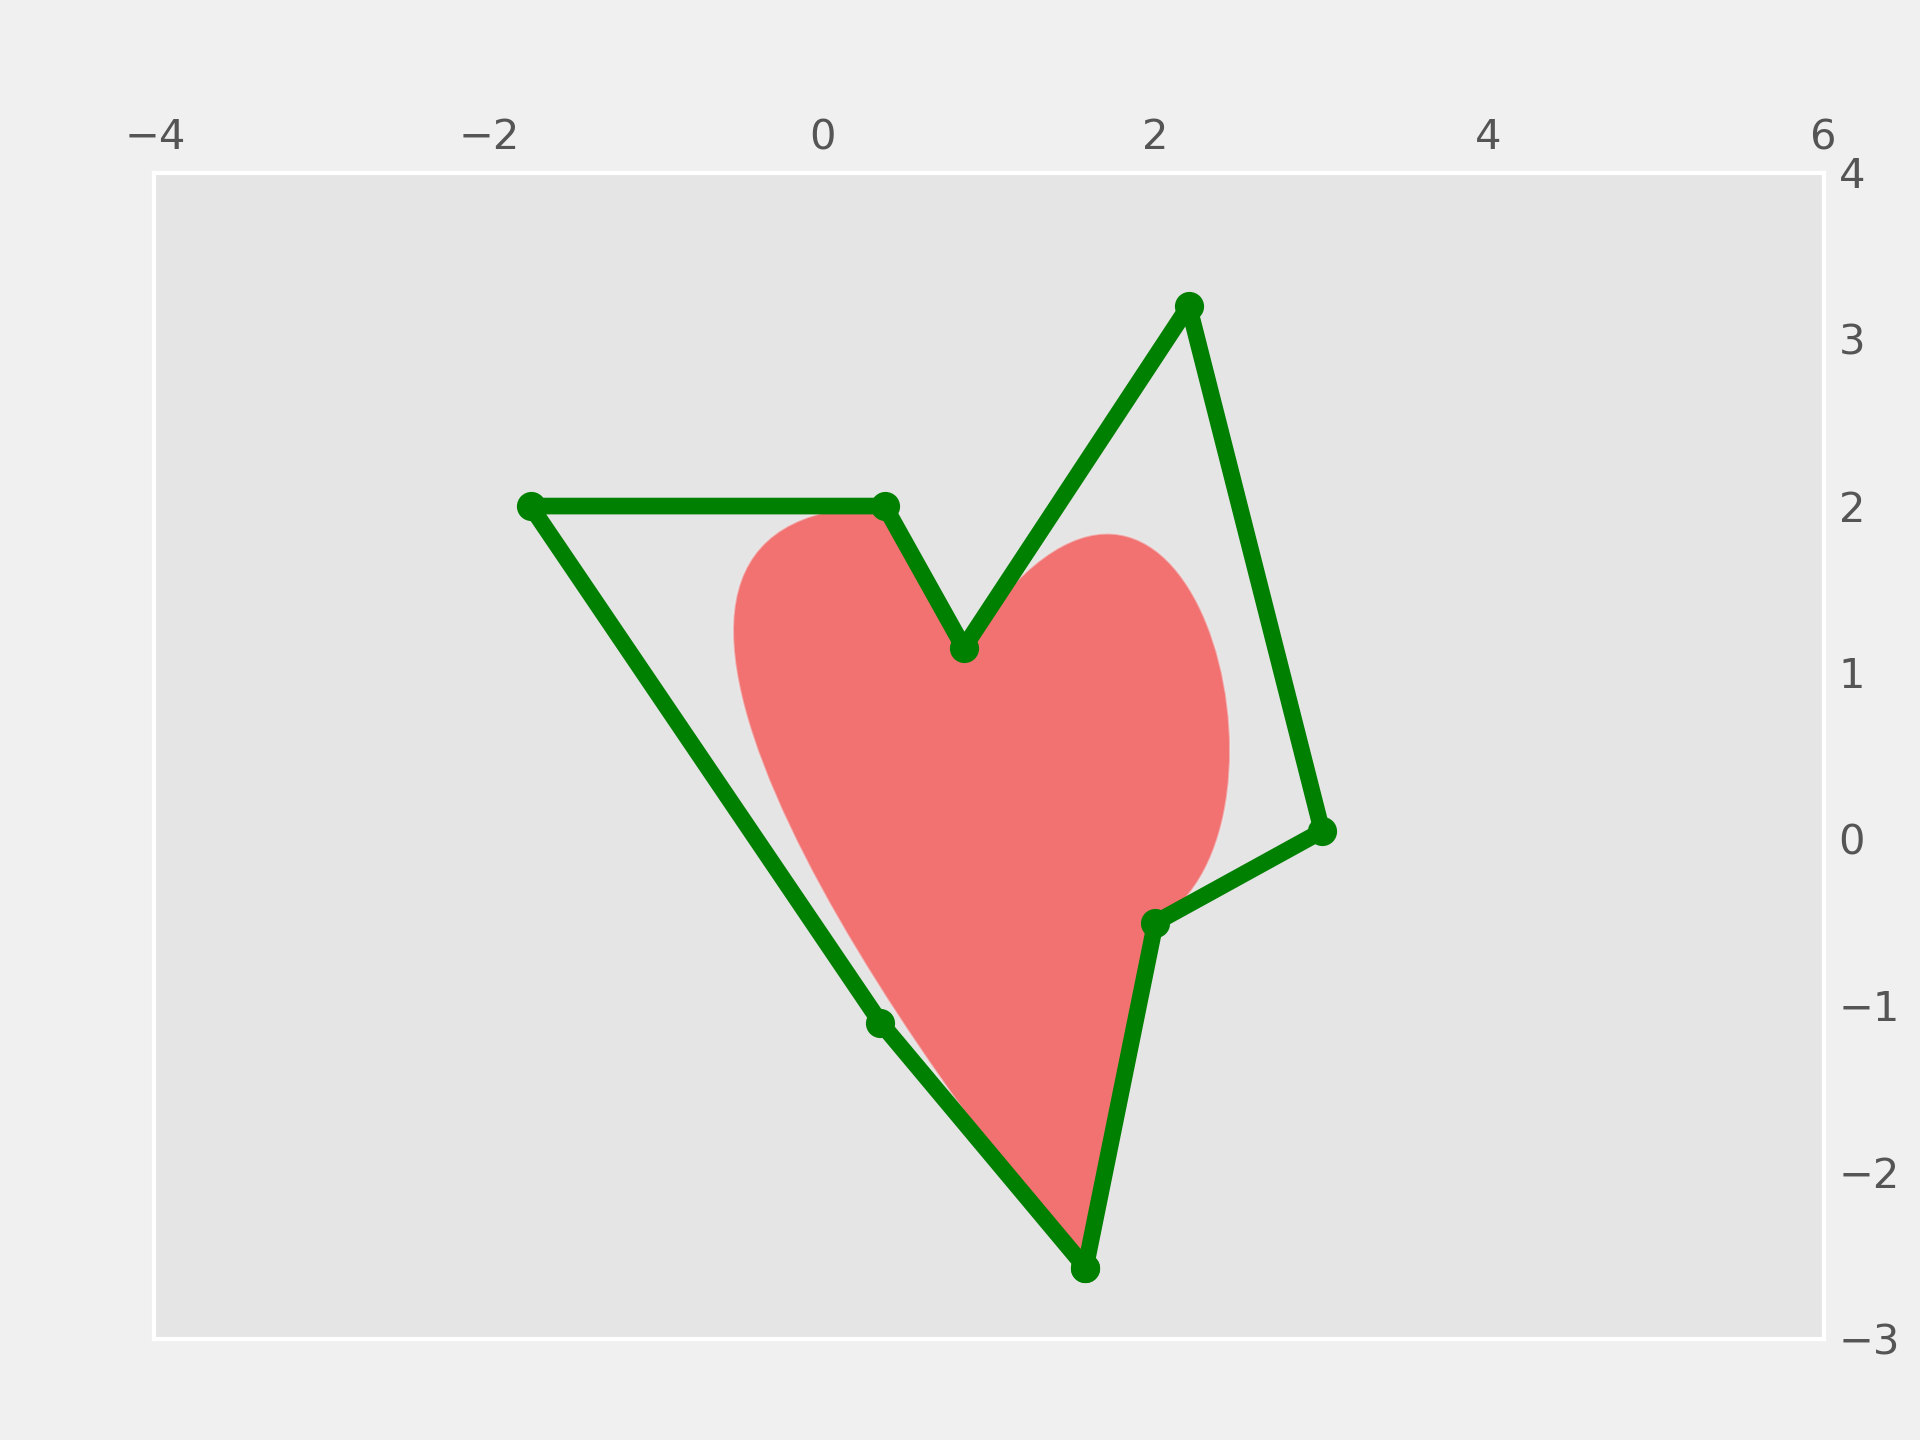
PathPatch object
================
This example shows how to create `~.path.Path` and `~.patches.PathPatch`
objects through Matplotlib's API.
"""
...
... import matplotlib.path as mpath
... import matplotlib.patches as mpatches
... import matplotlib.pyplot as plt
...
... fig, ax = plt.subplots()
...
... Path = mpath.Path
... path_data = [
... (Path.MOVETO, (1.58, -2.57)),
... (Path.CURVE4, (0.35, -1.1)),
... (Path.CURVE4, (-1.75, 2.0)),
... (Path.CURVE4, (0.375, 2.0)),
... (Path.LINETO, (0.85, 1.15)),
... (Path.CURVE4, (2.2, 3.2)),
... (Path.CURVE4, (3, 0.05)),
... (Path.CURVE4, (2.0, -0.5)),
... (Path.CLOSEPOLY, (1.58, -2.57)),
... ]
... codes, verts = zip(*path_data)
... path = mpath.Path(verts, codes)
... patch = mpatches.PathPatch(path, facecolor='r', alpha=0.5)
... ax.add_patch(patch)
...
... # plot control points and connecting lines
... x, y = zip(*path.vertices)
... line, = ax.plot(x, y, 'go-')
...
... ax.grid()
... ax.axis('equal')
... plt.show()
...
... #############################################################################
... #
... # .. admonition:: References
... #
... # The use of the following functions, methods, classes and modules is shown
... # in this example:
... #
... # - `matplotlib.path`
... # - `matplotlib.path.Path`
... # - `matplotlib.patches`
... # - `matplotlib.patches.PathPatch`
... # - `matplotlib.axes.Axes.add_patch`
...