>>> """
============================
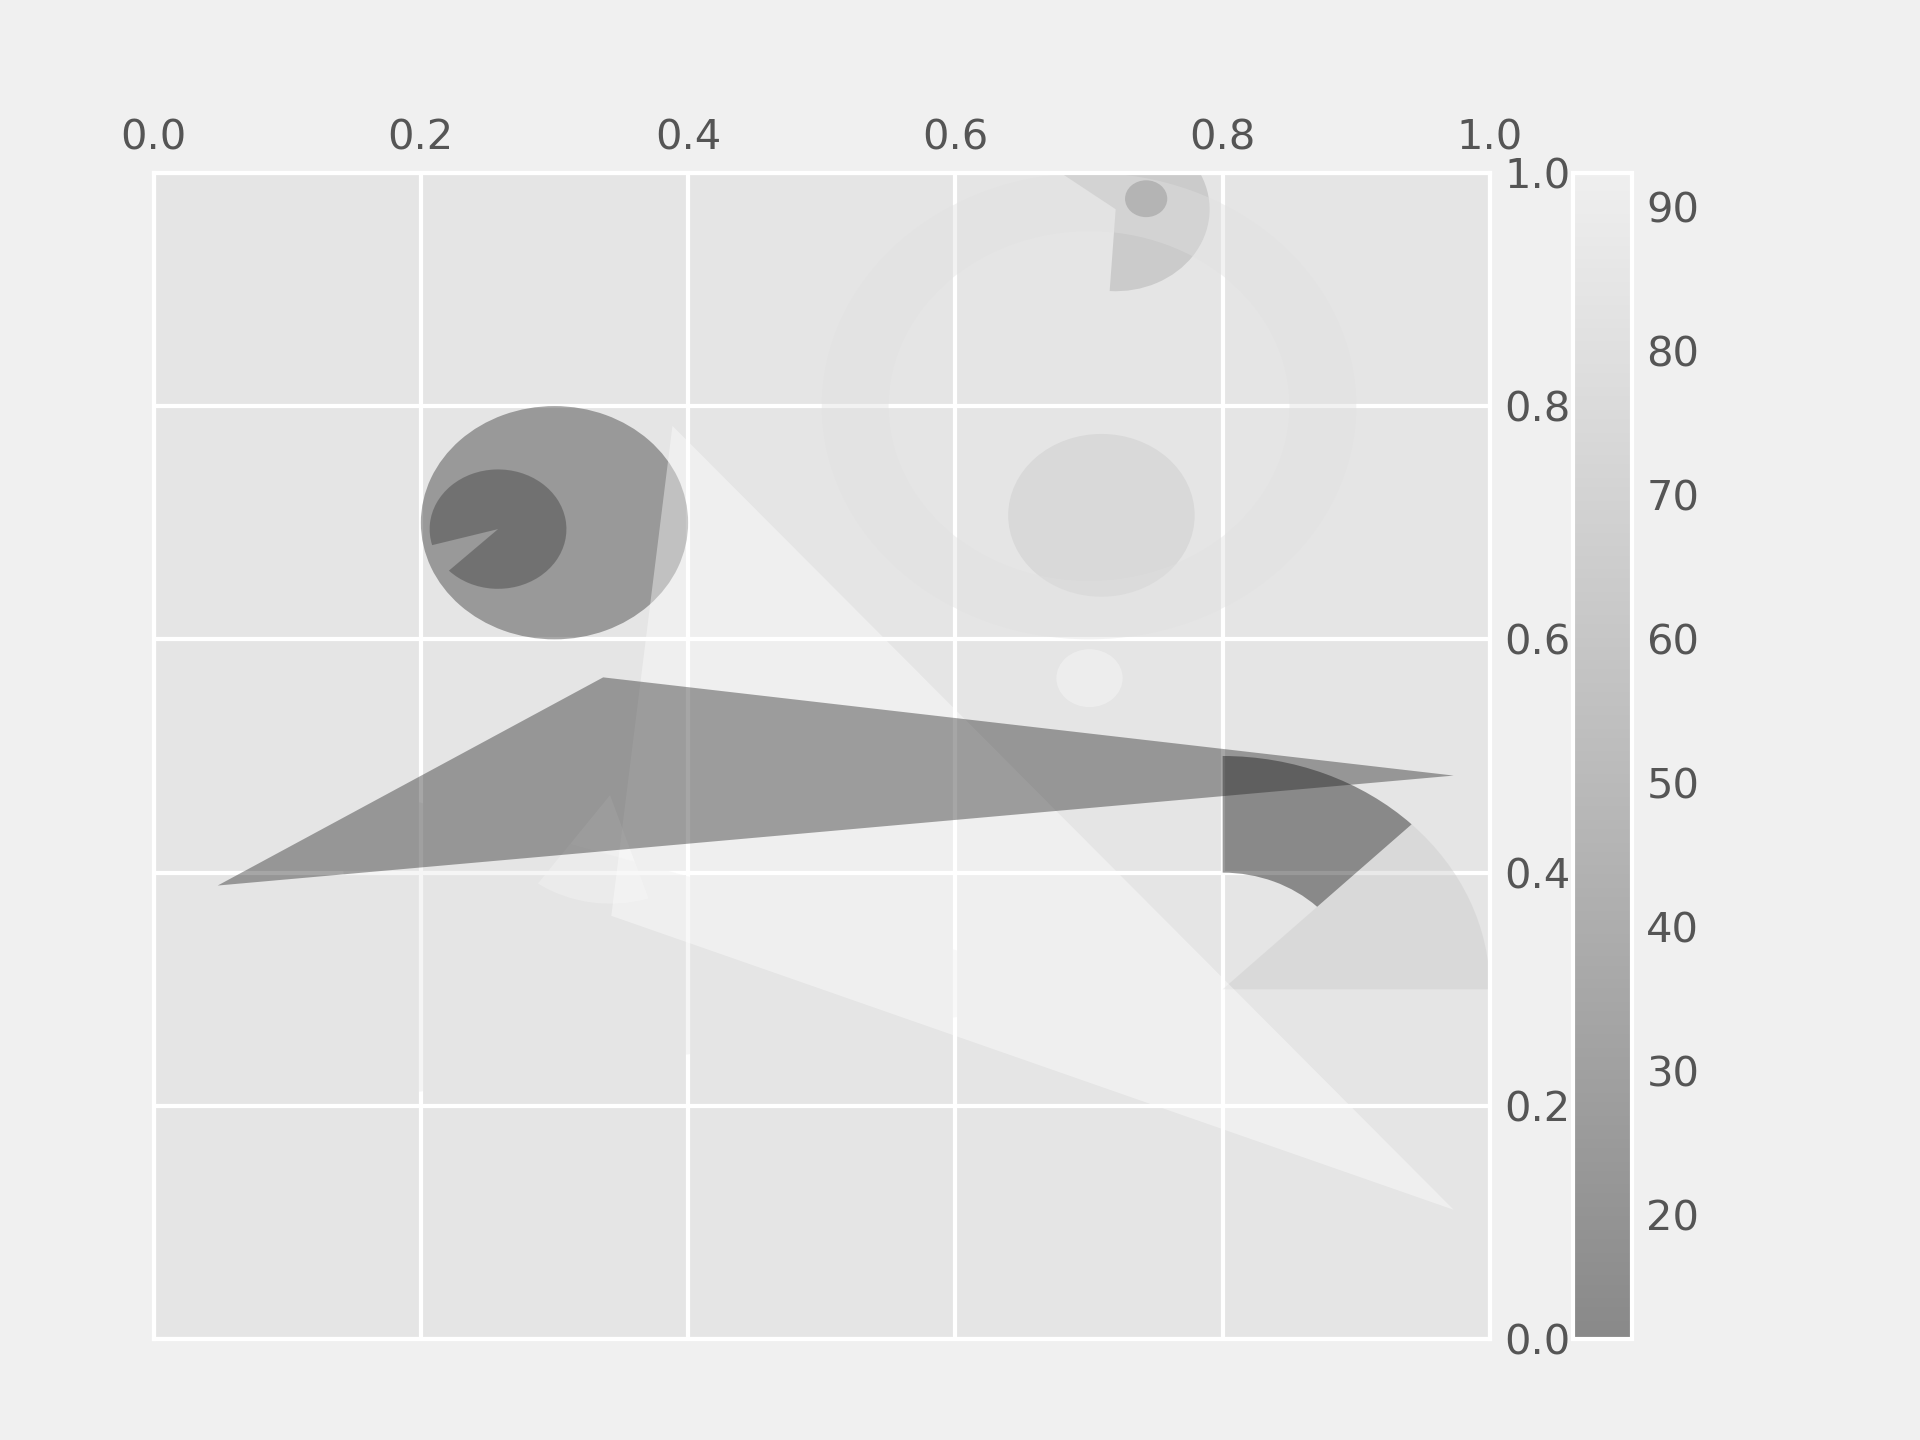
Circles, Wedges and Polygons
============================
This example demonstrates how to use `.collections.PatchCollection`.
"""
...
... import numpy as np
... from matplotlib.patches import Circle, Wedge, Polygon
... from matplotlib.collections import PatchCollection
... import matplotlib.pyplot as plt
...
... # Fixing random state for reproducibility
... np.random.seed(19680801)
...
...
... fig, ax = plt.subplots()
...
... resolution = 50 # the number of vertices
... N = 3
... x = np.random.rand(N)
... y = np.random.rand(N)
... radii = 0.1*np.random.rand(N)
... patches = []
... for x1, y1, r in zip(x, y, radii):
... circle = Circle((x1, y1), r)
... patches.append(circle)
...
... x = np.random.rand(N)
... y = np.random.rand(N)
... radii = 0.1*np.random.rand(N)
... theta1 = 360.0*np.random.rand(N)
... theta2 = 360.0*np.random.rand(N)
... for x1, y1, r, t1, t2 in zip(x, y, radii, theta1, theta2):
... wedge = Wedge((x1, y1), r, t1, t2)
... patches.append(wedge)
...
... # Some limiting conditions on Wedge
... patches += [
... Wedge((.3, .7), .1, 0, 360), # Full circle
... Wedge((.7, .8), .2, 0, 360, width=0.05), # Full ring
... Wedge((.8, .3), .2, 0, 45), # Full sector
... Wedge((.8, .3), .2, 45, 90, width=0.10), # Ring sector
... ]
...
... for i in range(N):
... polygon = Polygon(np.random.rand(N, 2), True)
... patches.append(polygon)
...
... colors = 100 * np.random.rand(len(patches))
... p = PatchCollection(patches, alpha=0.4)
... p.set_array(colors)
... ax.add_collection(p)
... fig.colorbar(p, ax=ax)
...
... plt.show()
...
... #############################################################################
... #
... # .. admonition:: References
... #
... # The use of the following functions, methods, classes and modules is shown
... # in this example:
... #
... # - `matplotlib.patches`
... # - `matplotlib.patches.Circle`
... # - `matplotlib.patches.Wedge`
... # - `matplotlib.patches.Polygon`
... # - `matplotlib.collections.PatchCollection`
... # - `matplotlib.collections.Collection.set_array`
... # - `matplotlib.axes.Axes.add_collection`
... # - `matplotlib.figure.Figure.colorbar`
...