>>> """
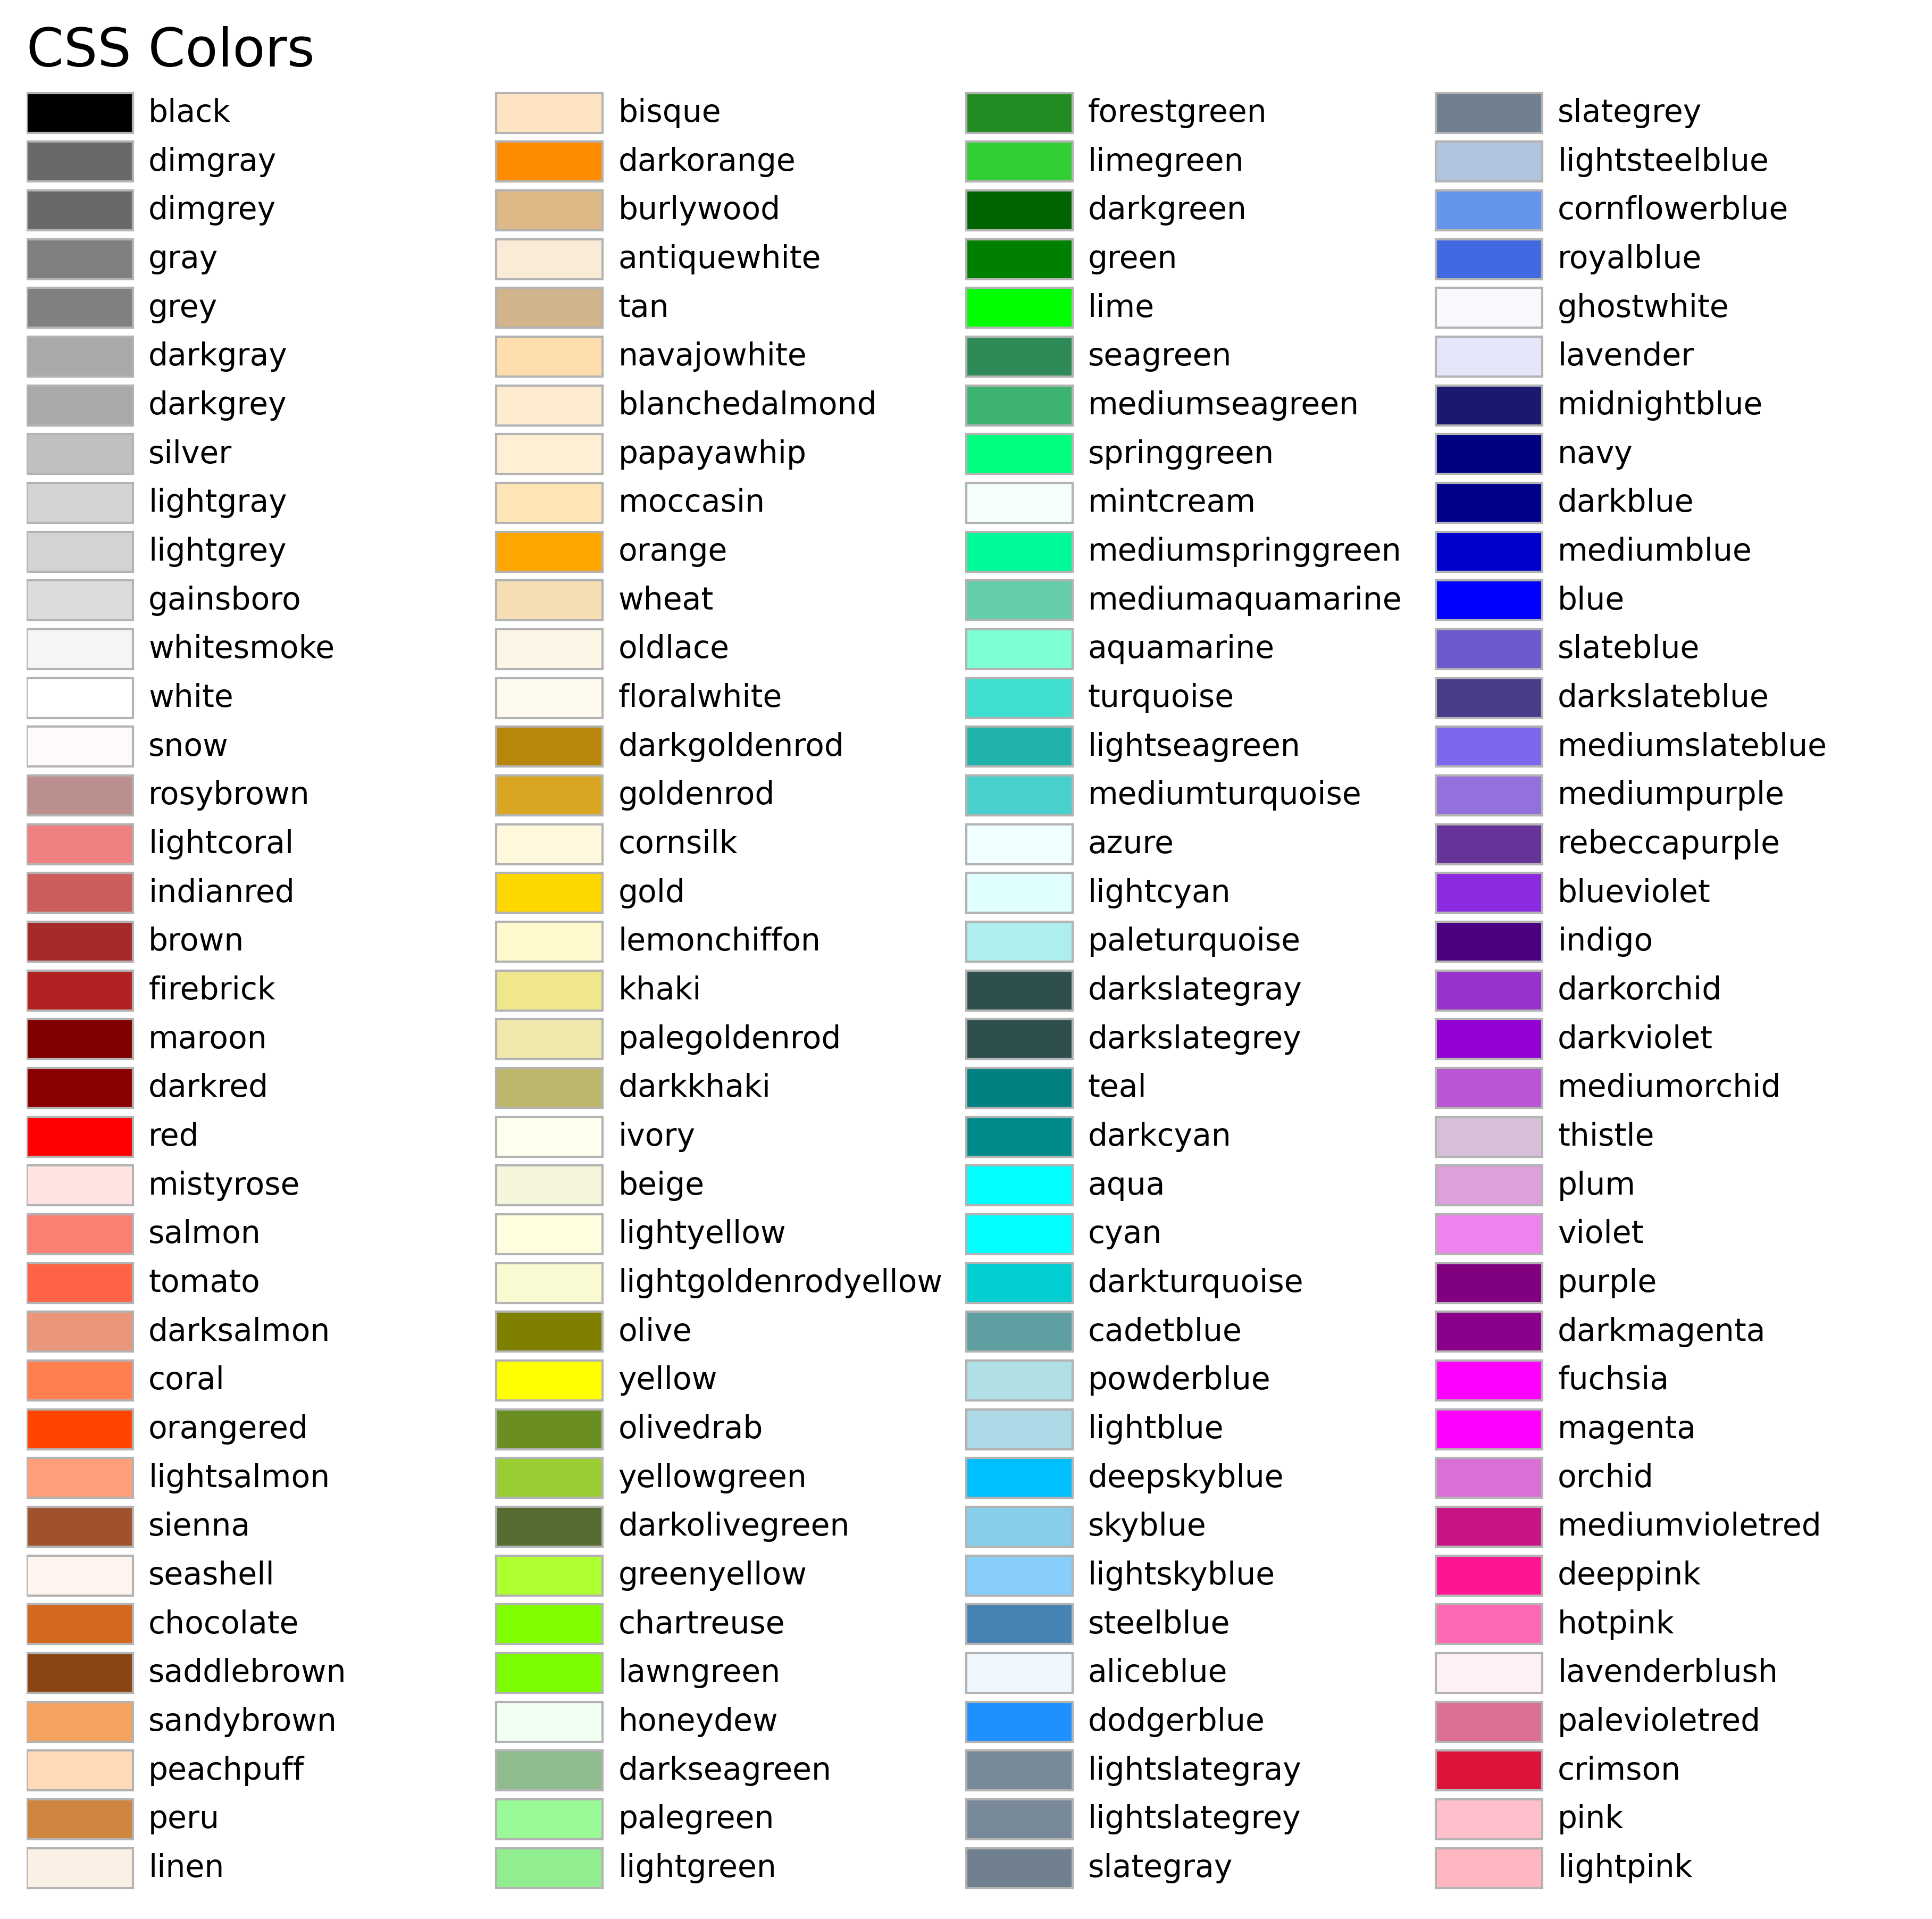
====================
List of named colors
====================
This plots a list of the named colors supported in matplotlib. Note that
:ref:`xkcd colors <xkcd-colors>` are supported as well, but are not listed here
for brevity.
For more information on colors in matplotlib see
* the :doc:`/tutorials/colors/colors` tutorial;
* the `matplotlib.colors` API;
* the :doc:`/gallery/color/color_demo`.
"""
...
... from matplotlib.patches import Rectangle
... import matplotlib.pyplot as plt
... import matplotlib.colors as mcolors
...
...
... def plot_colortable(colors, title, sort_colors=True, emptycols=0):
...
... cell_width = 212
... cell_height = 22
... swatch_width = 48
... margin = 12
... topmargin = 40
...
... # Sort colors by hue, saturation, value and name.
... if sort_colors is True:
... by_hsv = sorted((tuple(mcolors.rgb_to_hsv(mcolors.to_rgb(color))),
... name)
... for name, color in colors.items())
... names = [name for hsv, name in by_hsv]
... else:
... names = list(colors)
...
... n = len(names)
... ncols = 4 - emptycols
... nrows = n // ncols + int(n % ncols > 0)
...
... width = cell_width * 4 + 2 * margin
... height = cell_height * nrows + margin + topmargin
... dpi = 72
...
... fig, ax = plt.subplots(figsize=(width / dpi, height / dpi), dpi=dpi)
... fig.subplots_adjust(margin/width, margin/height,
... (width-margin)/width, (height-topmargin)/height)
... ax.set_xlim(0, cell_width * 4)
... ax.set_ylim(cell_height * (nrows-0.5), -cell_height/2.)
... ax.yaxis.set_visible(False)
... ax.xaxis.set_visible(False)
... ax.set_axis_off()
... ax.set_title(title, fontsize=24, loc="left", pad=10)
...
... for i, name in enumerate(names):
... row = i % nrows
... col = i // nrows
... y = row * cell_height
...
... swatch_start_x = cell_width * col
... text_pos_x = cell_width * col + swatch_width + 7
...
... ax.text(text_pos_x, y, name, fontsize=14,
... horizontalalignment='left',
... verticalalignment='center')
...
... ax.add_patch(
... Rectangle(xy=(swatch_start_x, y-9), width=swatch_width,
... height=18, facecolor=colors[name], edgecolor='0.7')
... )
...
... return fig
...
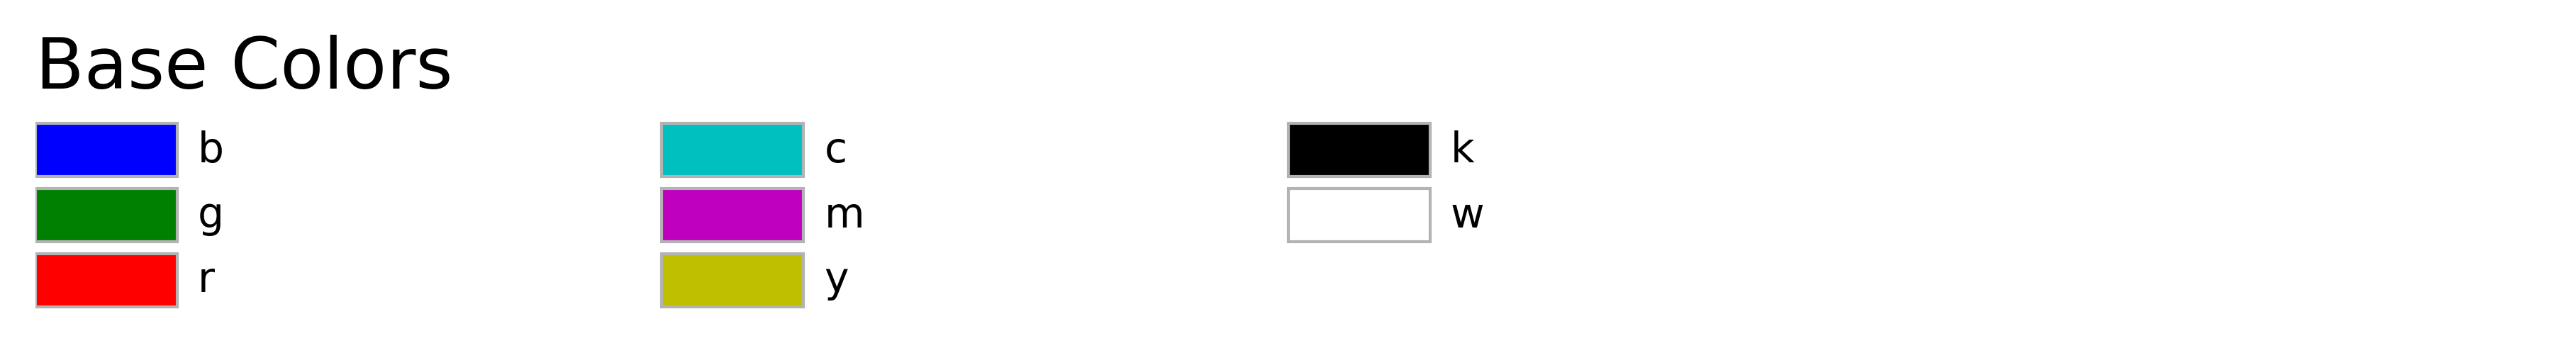
... plot_colortable(mcolors.BASE_COLORS, "Base Colors",
... sort_colors=False, emptycols=1)
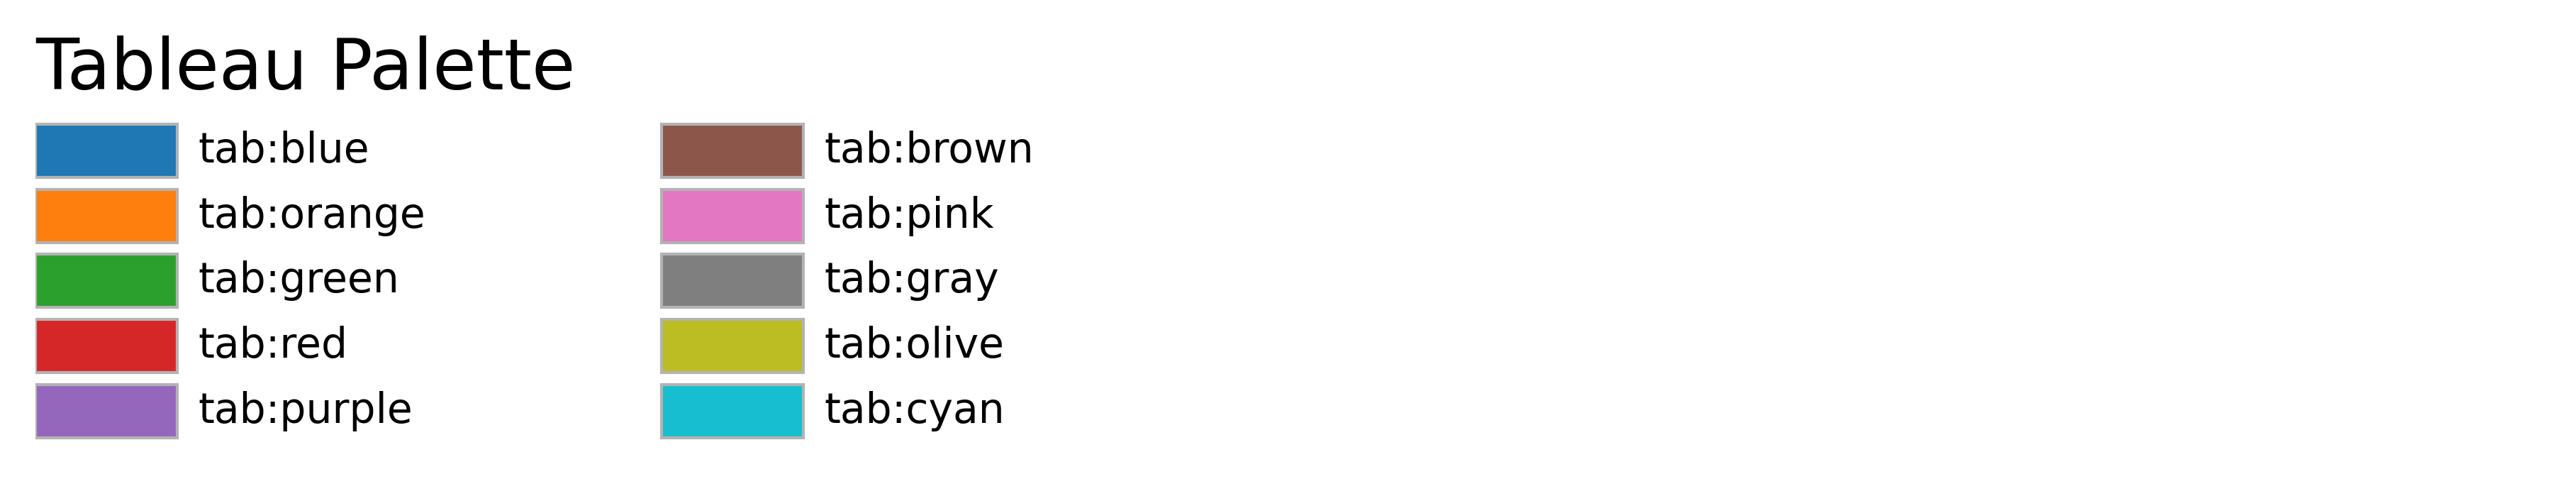
... plot_colortable(mcolors.TABLEAU_COLORS, "Tableau Palette",
... sort_colors=False, emptycols=2)
...
... # sphinx_gallery_thumbnail_number = 3
... plot_colortable(mcolors.CSS4_COLORS, "CSS Colors")
...
... # Optionally plot the XKCD colors (Caution: will produce large figure)
... # xkcd_fig = plot_colortable(mcolors.XKCD_COLORS, "XKCD Colors")
... # xkcd_fig.savefig("XKCD_Colors.png")
...
... plt.show()
...
...
... #############################################################################
... #
... # .. admonition:: References
... #
... # The use of the following functions, methods, classes and modules is shown
... # in this example:
... #
... # - `matplotlib.colors`
... # - `matplotlib.colors.rgb_to_hsv`
... # - `matplotlib.colors.to_rgba`
... # - `matplotlib.figure.Figure.get_size_inches`
... # - `matplotlib.figure.Figure.subplots_adjust`
... # - `matplotlib.axes.Axes.text`
... # - `matplotlib.patches.Rectangle`
...