>>> r"""
==========================
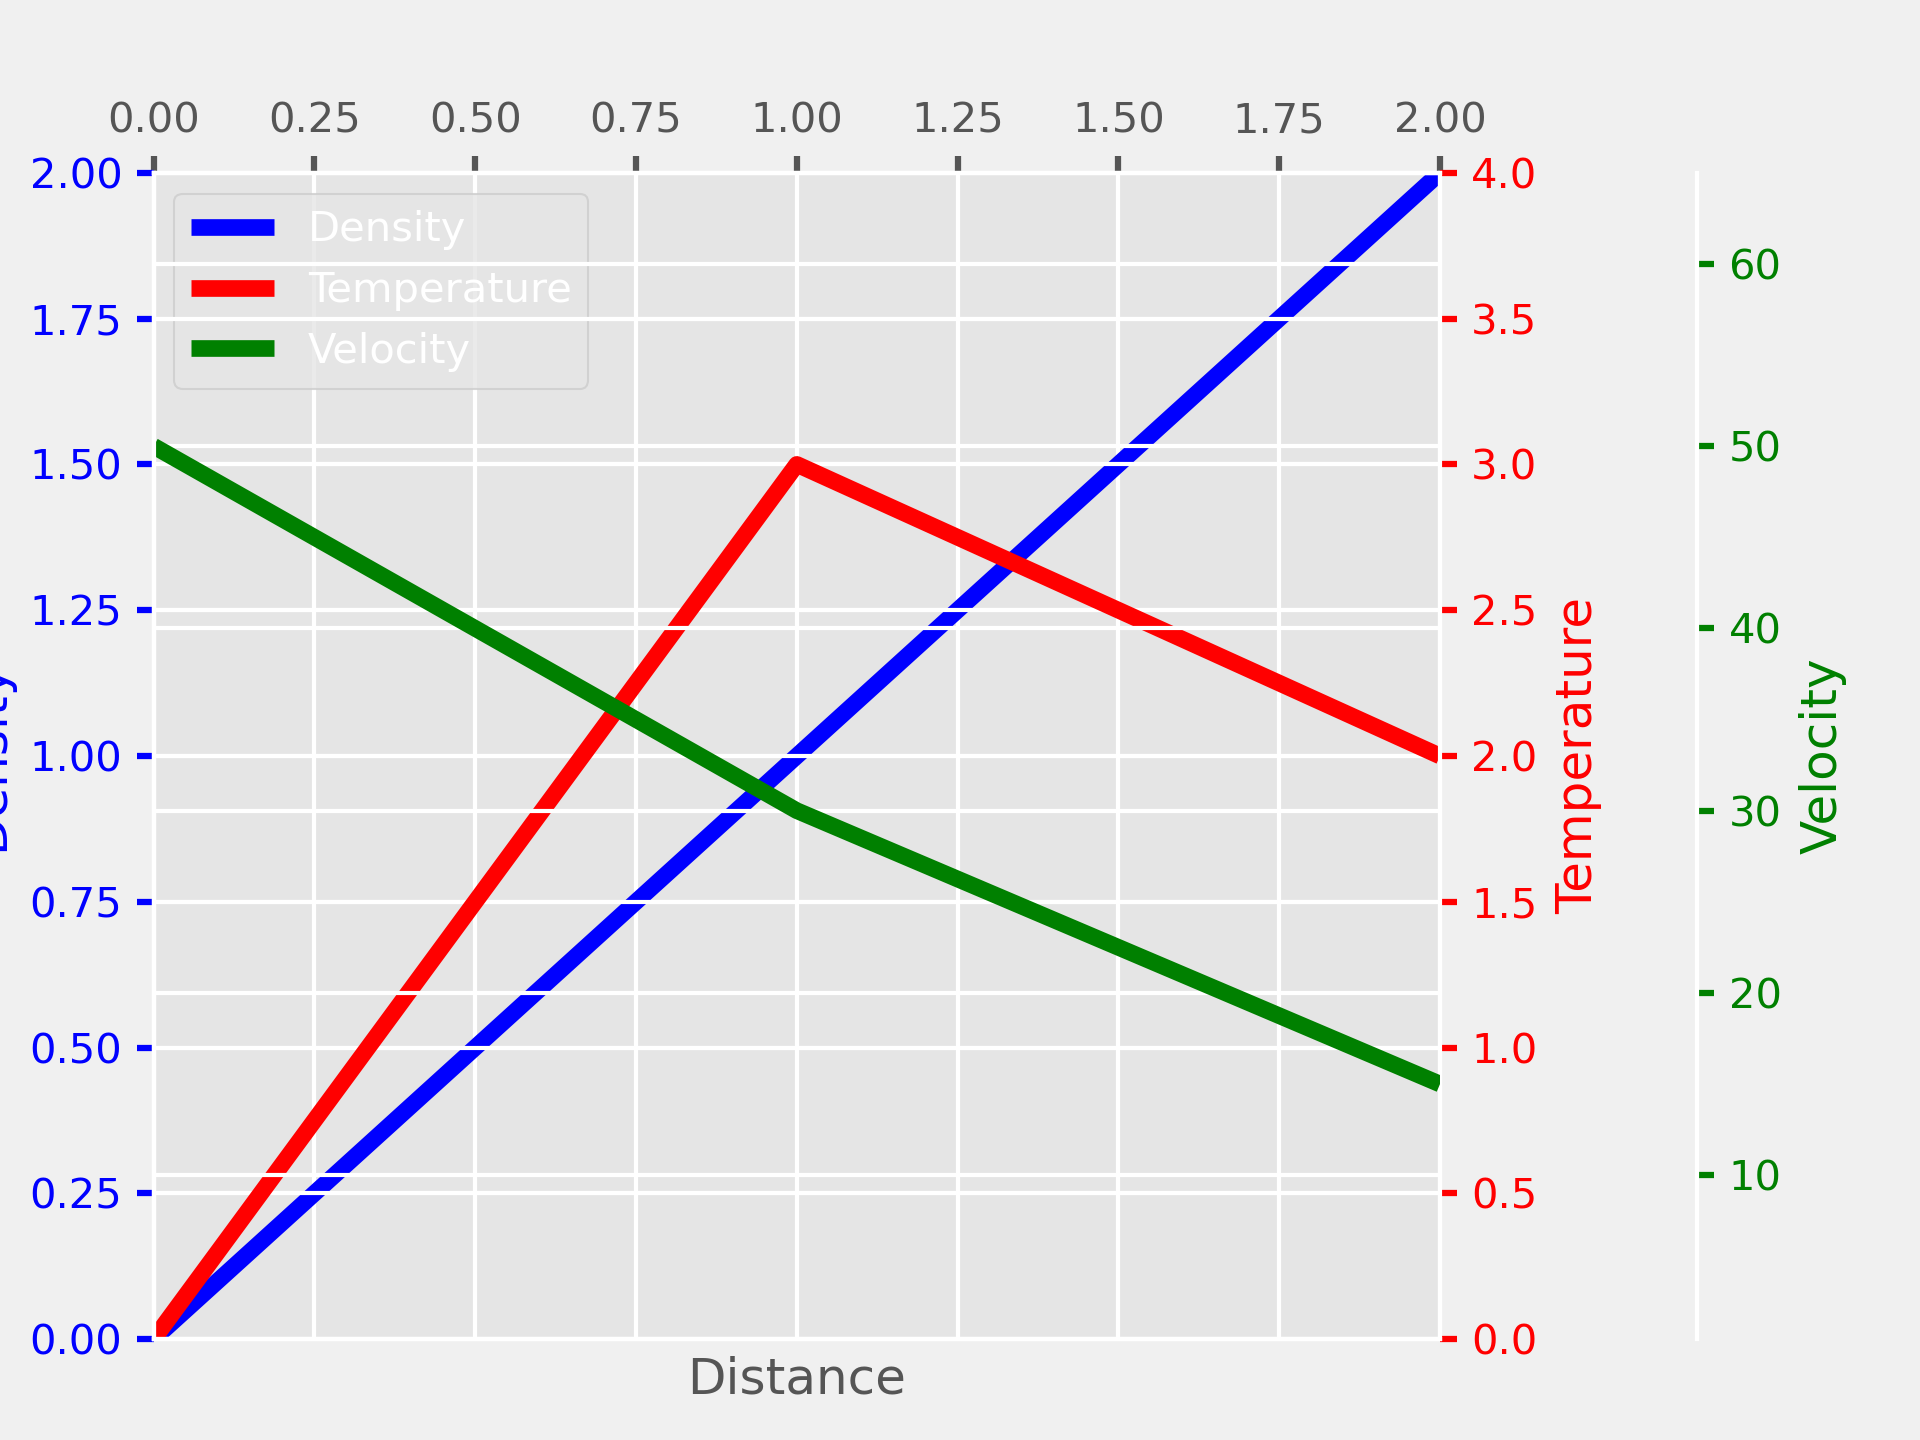
Multiple Yaxis With Spines
==========================
Create multiple y axes with a shared x axis. This is done by creating
a `~.axes.Axes.twinx` axes, turning all spines but the right one invisible
and offset its position using `~.spines.Spine.set_position`.
Note that this approach uses `matplotlib.axes.Axes` and their
`~matplotlib.spines.Spine`\s. An alternative approach for parasite
axes is shown in the :doc:`/gallery/axisartist/demo_parasite_axes` and
:doc:`/gallery/axisartist/demo_parasite_axes2` examples.
"""
...
... import matplotlib.pyplot as plt
...
...
... fig, ax = plt.subplots()
... fig.subplots_adjust(right=0.75)
...
... twin1 = ax.twinx()
... twin2 = ax.twinx()
...
... # Offset the right spine of twin2. The ticks and label have already been
... # placed on the right by twinx above.
... twin2.spines.right.set_position(("axes", 1.2))
...
... p1, = ax.plot([0, 1, 2], [0, 1, 2], "b-", label="Density")
... p2, = twin1.plot([0, 1, 2], [0, 3, 2], "r-", label="Temperature")
... p3, = twin2.plot([0, 1, 2], [50, 30, 15], "g-", label="Velocity")
...
... ax.set_xlim(0, 2)
... ax.set_ylim(0, 2)
... twin1.set_ylim(0, 4)
... twin2.set_ylim(1, 65)
...
... ax.set_xlabel("Distance")
... ax.set_ylabel("Density")
... twin1.set_ylabel("Temperature")
... twin2.set_ylabel("Velocity")
...
... ax.yaxis.label.set_color(p1.get_color())
... twin1.yaxis.label.set_color(p2.get_color())
... twin2.yaxis.label.set_color(p3.get_color())
...
... tkw = dict(size=4, width=1.5)
... ax.tick_params(axis='y', colors=p1.get_color(), **tkw)
... twin1.tick_params(axis='y', colors=p2.get_color(), **tkw)
... twin2.tick_params(axis='y', colors=p3.get_color(), **tkw)
... ax.tick_params(axis='x', **tkw)
...
... ax.legend(handles=[p1, p2, p3])
...
... plt.show()
...