>>> """
===================================
Managing multiple figures in pyplot
===================================
`matplotlib.pyplot` uses the concept of a *current figure* and *current axes*.
Figures are identified via a figure number that is passed to `~.pyplot.figure`.
The figure with the given number is set as *current figure*. Additionally, if
no figure with the number exists, a new one is created.
.. note::
We discourage working with multiple figures in pyplot because managing
the *current figure* is cumbersome and error-prone. Instead, we recommend
to use the object-oriented approach and call methods on Figure and Axes
instances.
"""
... import matplotlib.pyplot as plt
... import numpy as np
...
... t = np.arange(0.0, 2.0, 0.01)
... s1 = np.sin(2*np.pi*t)
... s2 = np.sin(4*np.pi*t)
...
... ###############################################################################
... # Create figure 1
...
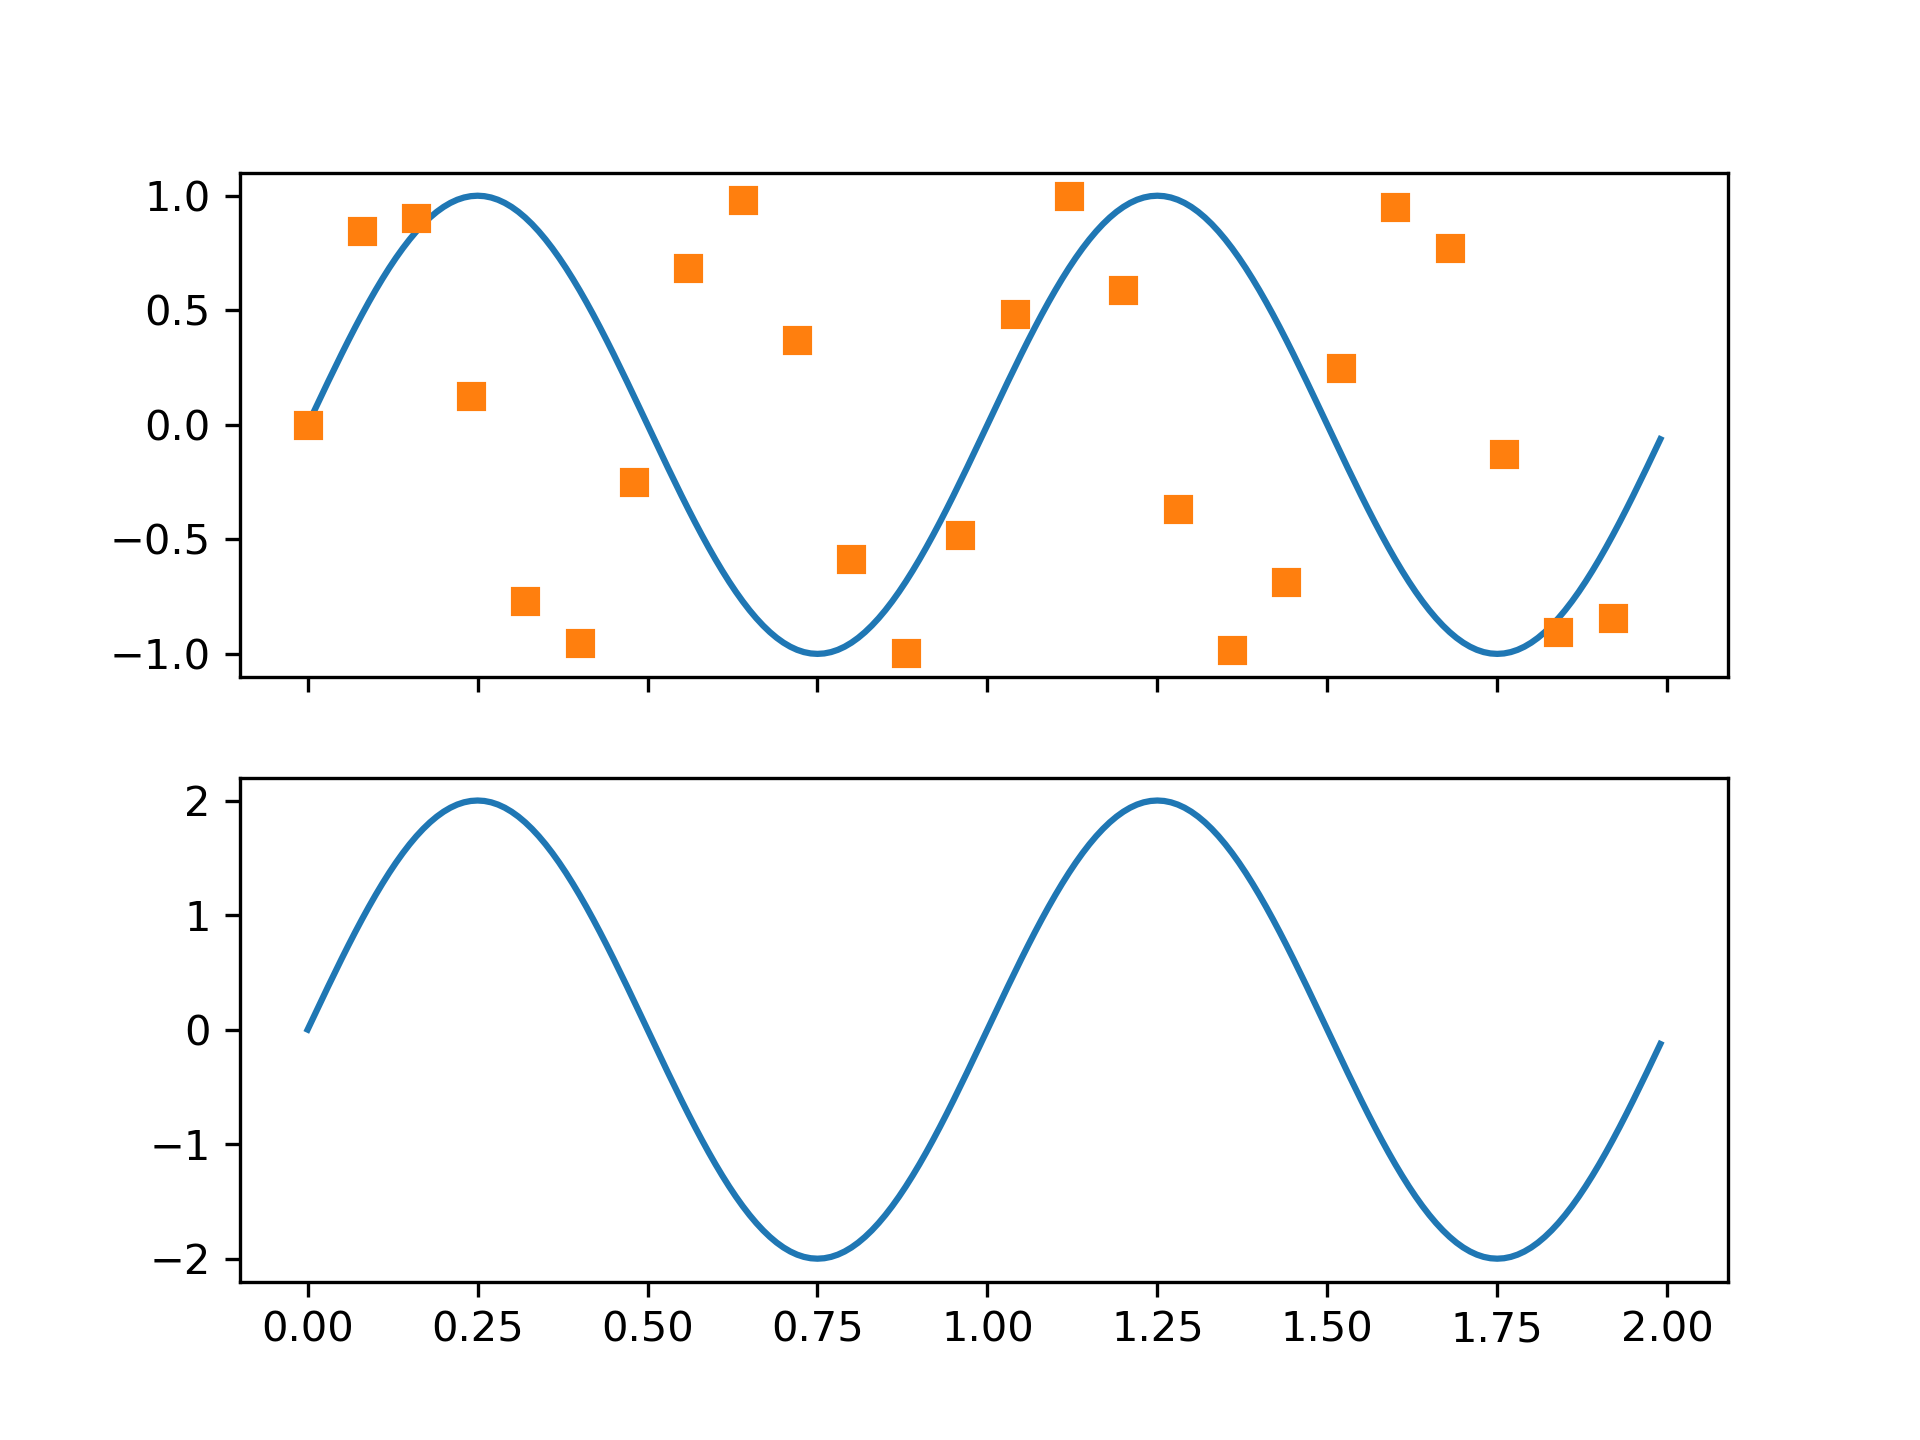
... plt.figure(1)
... plt.subplot(211)
... plt.plot(t, s1)
... plt.subplot(212)
... plt.plot(t, 2*s1)
...
... ###############################################################################
... # Create figure 2
...
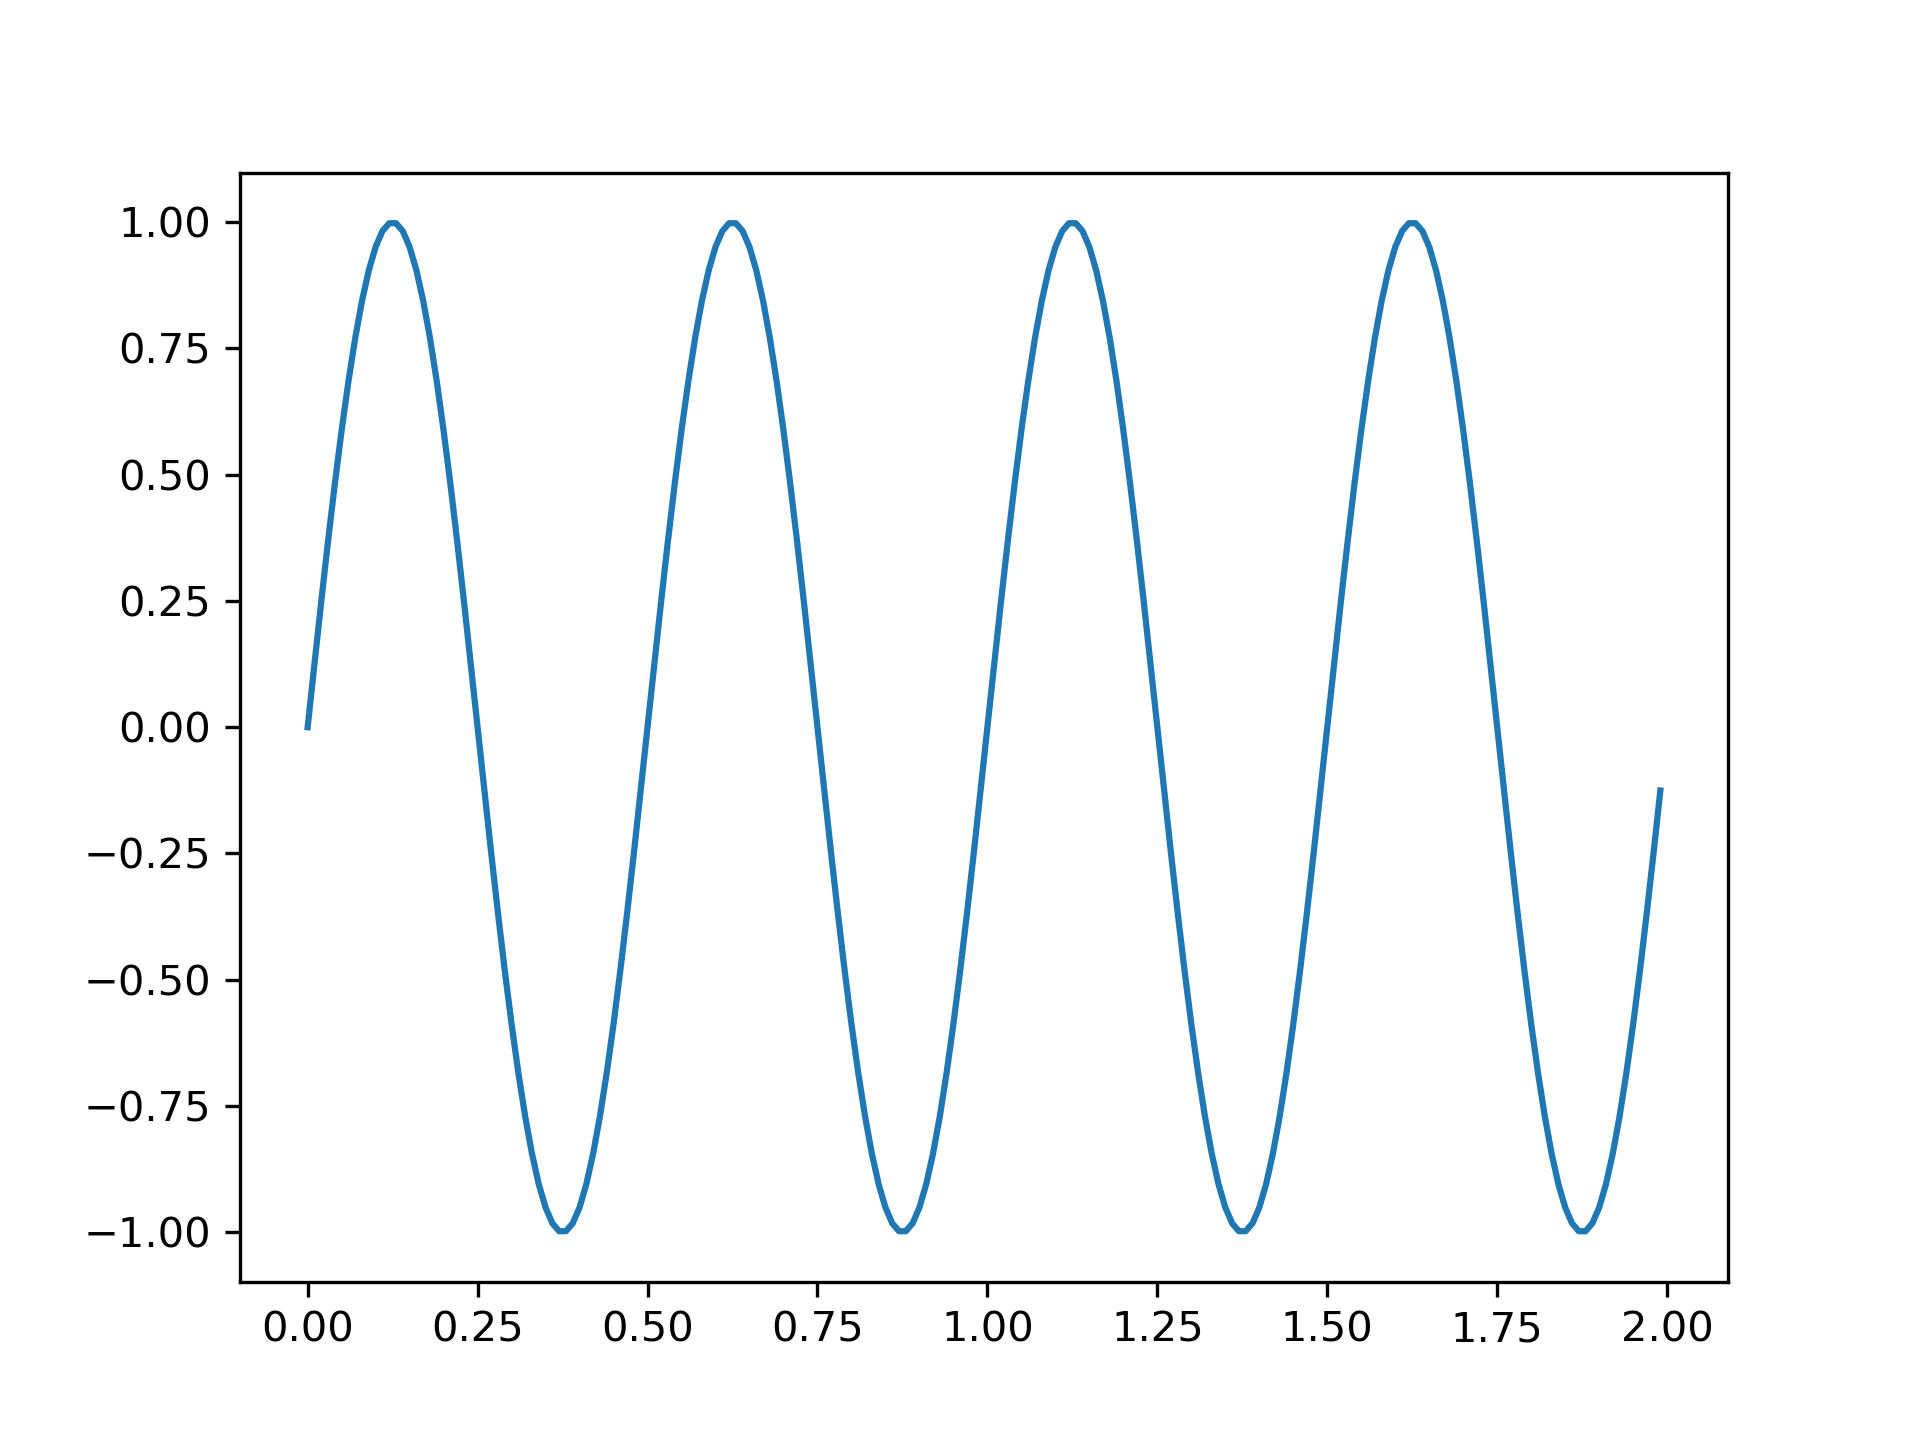
... plt.figure(2)
... plt.plot(t, s2)
...
... ###############################################################################
... # Now switch back to figure 1 and make some changes
...
... plt.figure(1)
... plt.subplot(211)
... plt.plot(t, s2, 's')
... ax = plt.gca()
... ax.set_xticklabels([])
...
... plt.show()
...