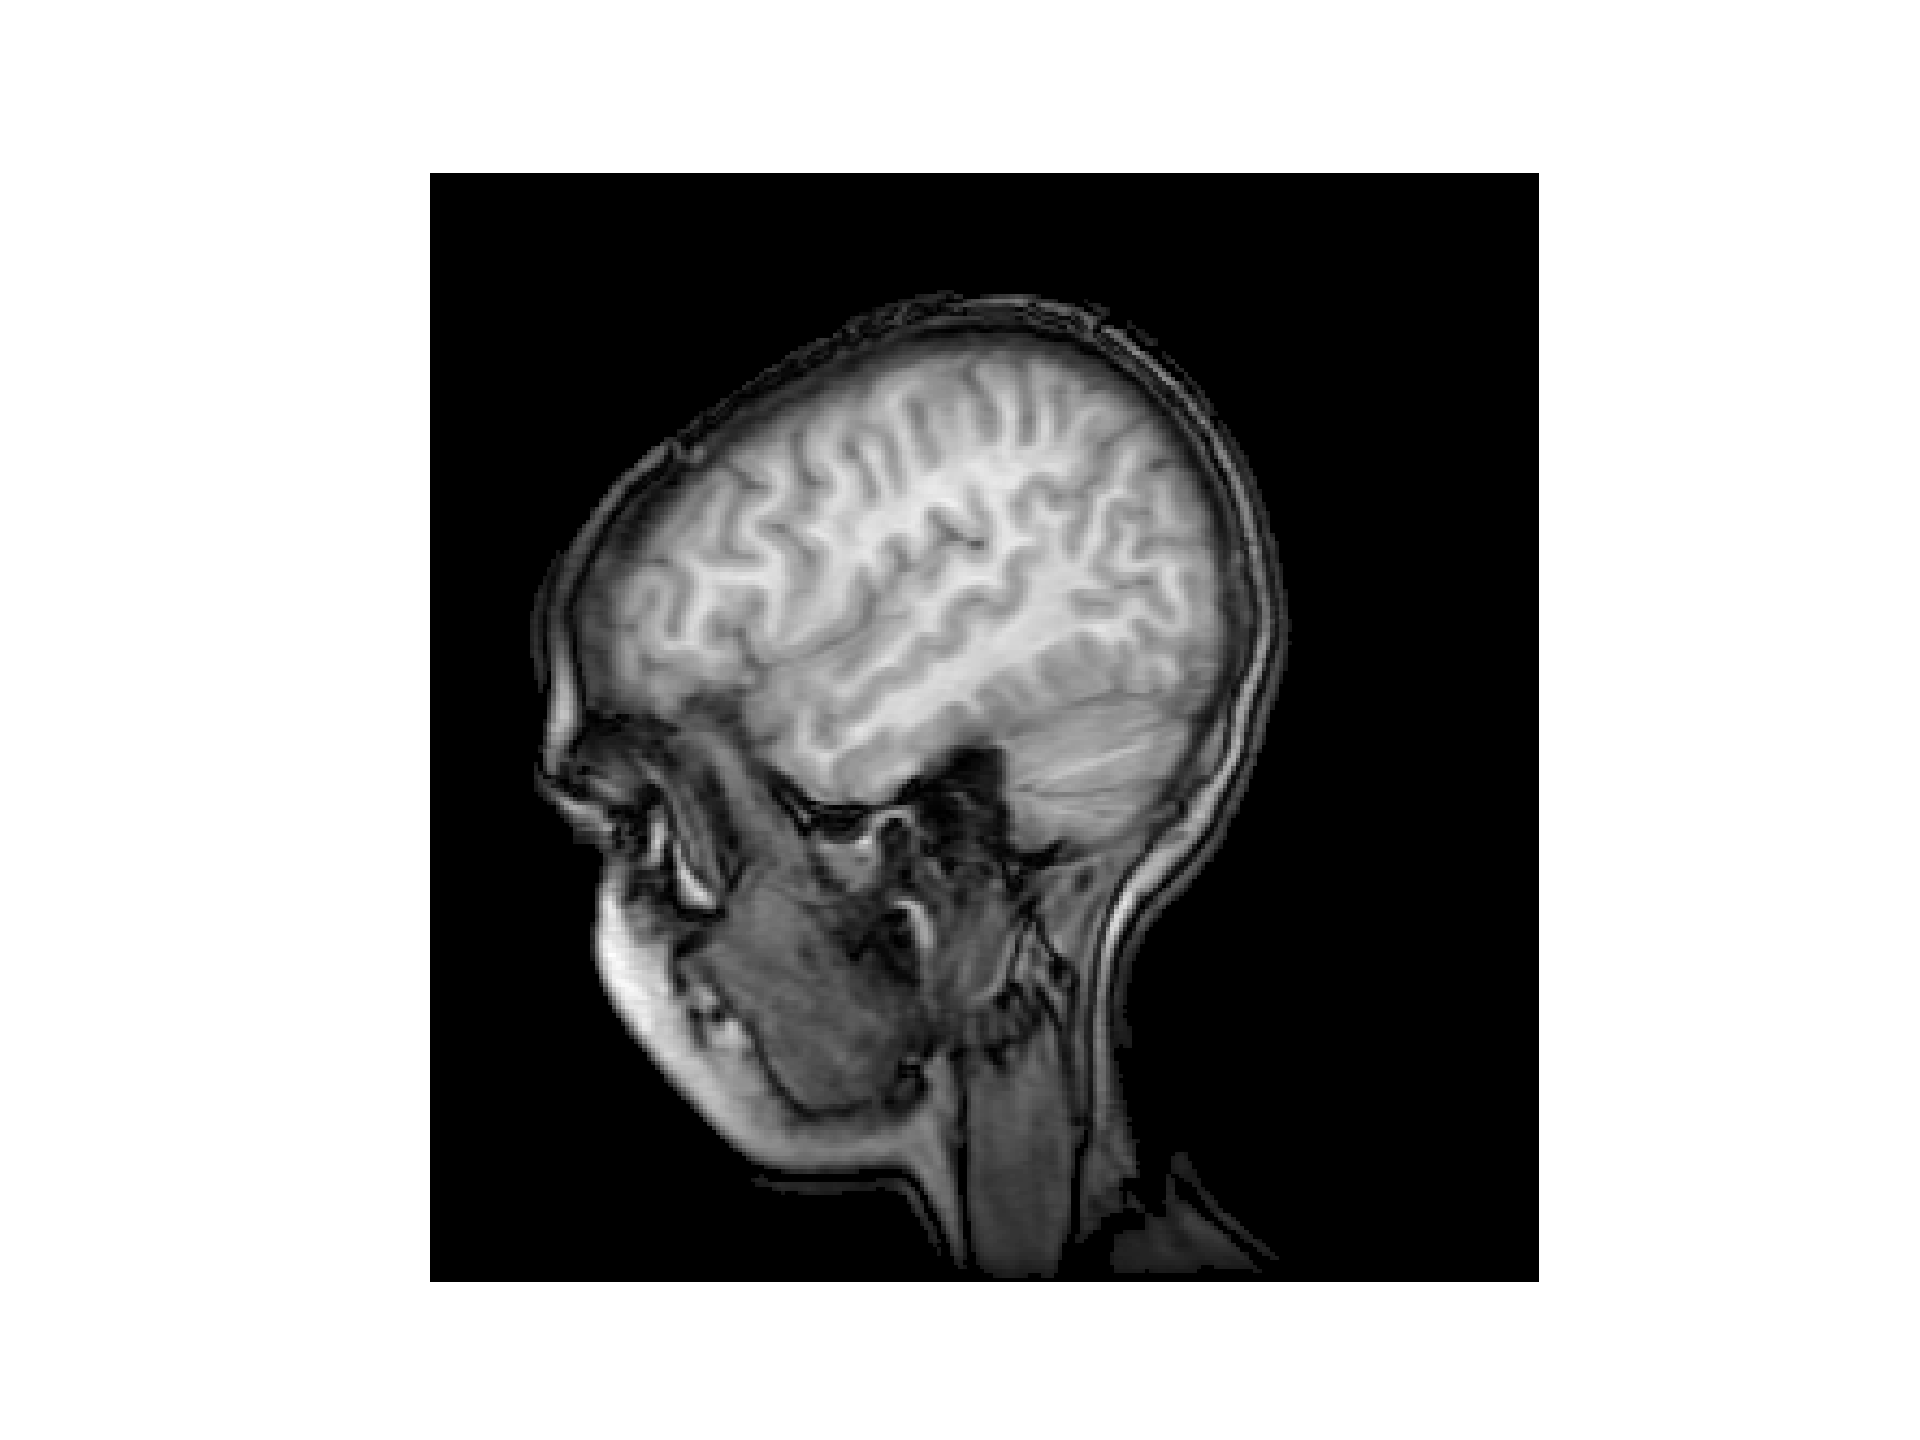
>>> """
===
MRI
===

This example illustrates how to read an image (of an MRI) into a NumPy
array, and display it in greyscale using `~.axes.Axes.imshow`.
"""
...
... import matplotlib.pyplot as plt
... import matplotlib.cbook as cbook
... import numpy as np
...
...
... # Data are 256x256 16 bit integers.
... with cbook.get_sample_data('s1045.ima.gz') as dfile:
...     im = np.frombuffer(dfile.read(), np.uint16).reshape((256, 256))
...
... fig, ax = plt.subplots(num="MRI_demo")
... ax.imshow(im, cmap="gray")
... ax.axis('off')
...
... plt.show()
...