>>> """
=======
Matshow
=======
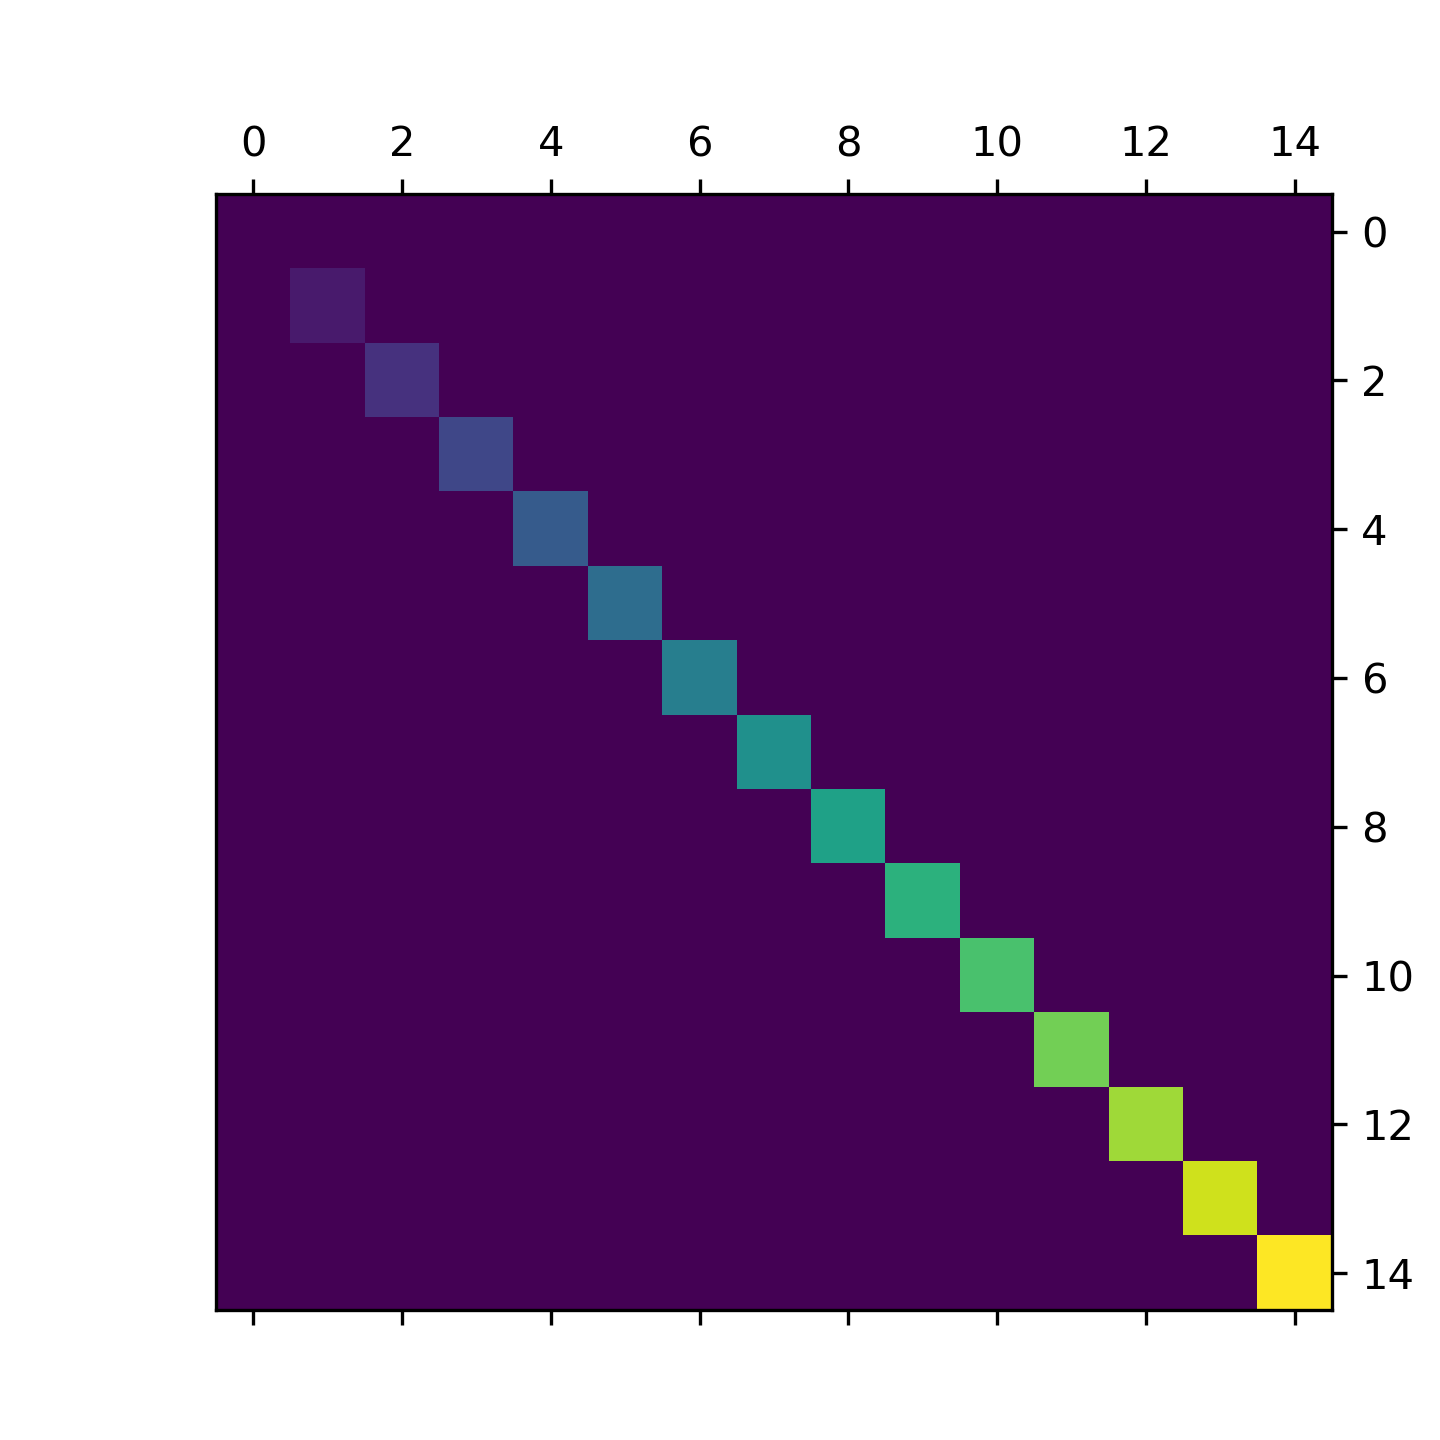
`~.axes.Axes.matshow` visualizes a 2D matrix or array as color-coded image.
"""
... import matplotlib.pyplot as plt
... import numpy as np
...
... # a 2D array with linearly increasing values on the diagonal
... a = np.diag(range(15))
...
... plt.matshow(a)
...
... plt.show()
...
... #############################################################################
... #
... # .. admonition:: References
... #
... # The use of the following functions, methods, classes and modules is shown
... # in this example:
... #
... # - `matplotlib.axes.Axes.imshow` / `matplotlib.pyplot.imshow`
...