>>> """
=========================================
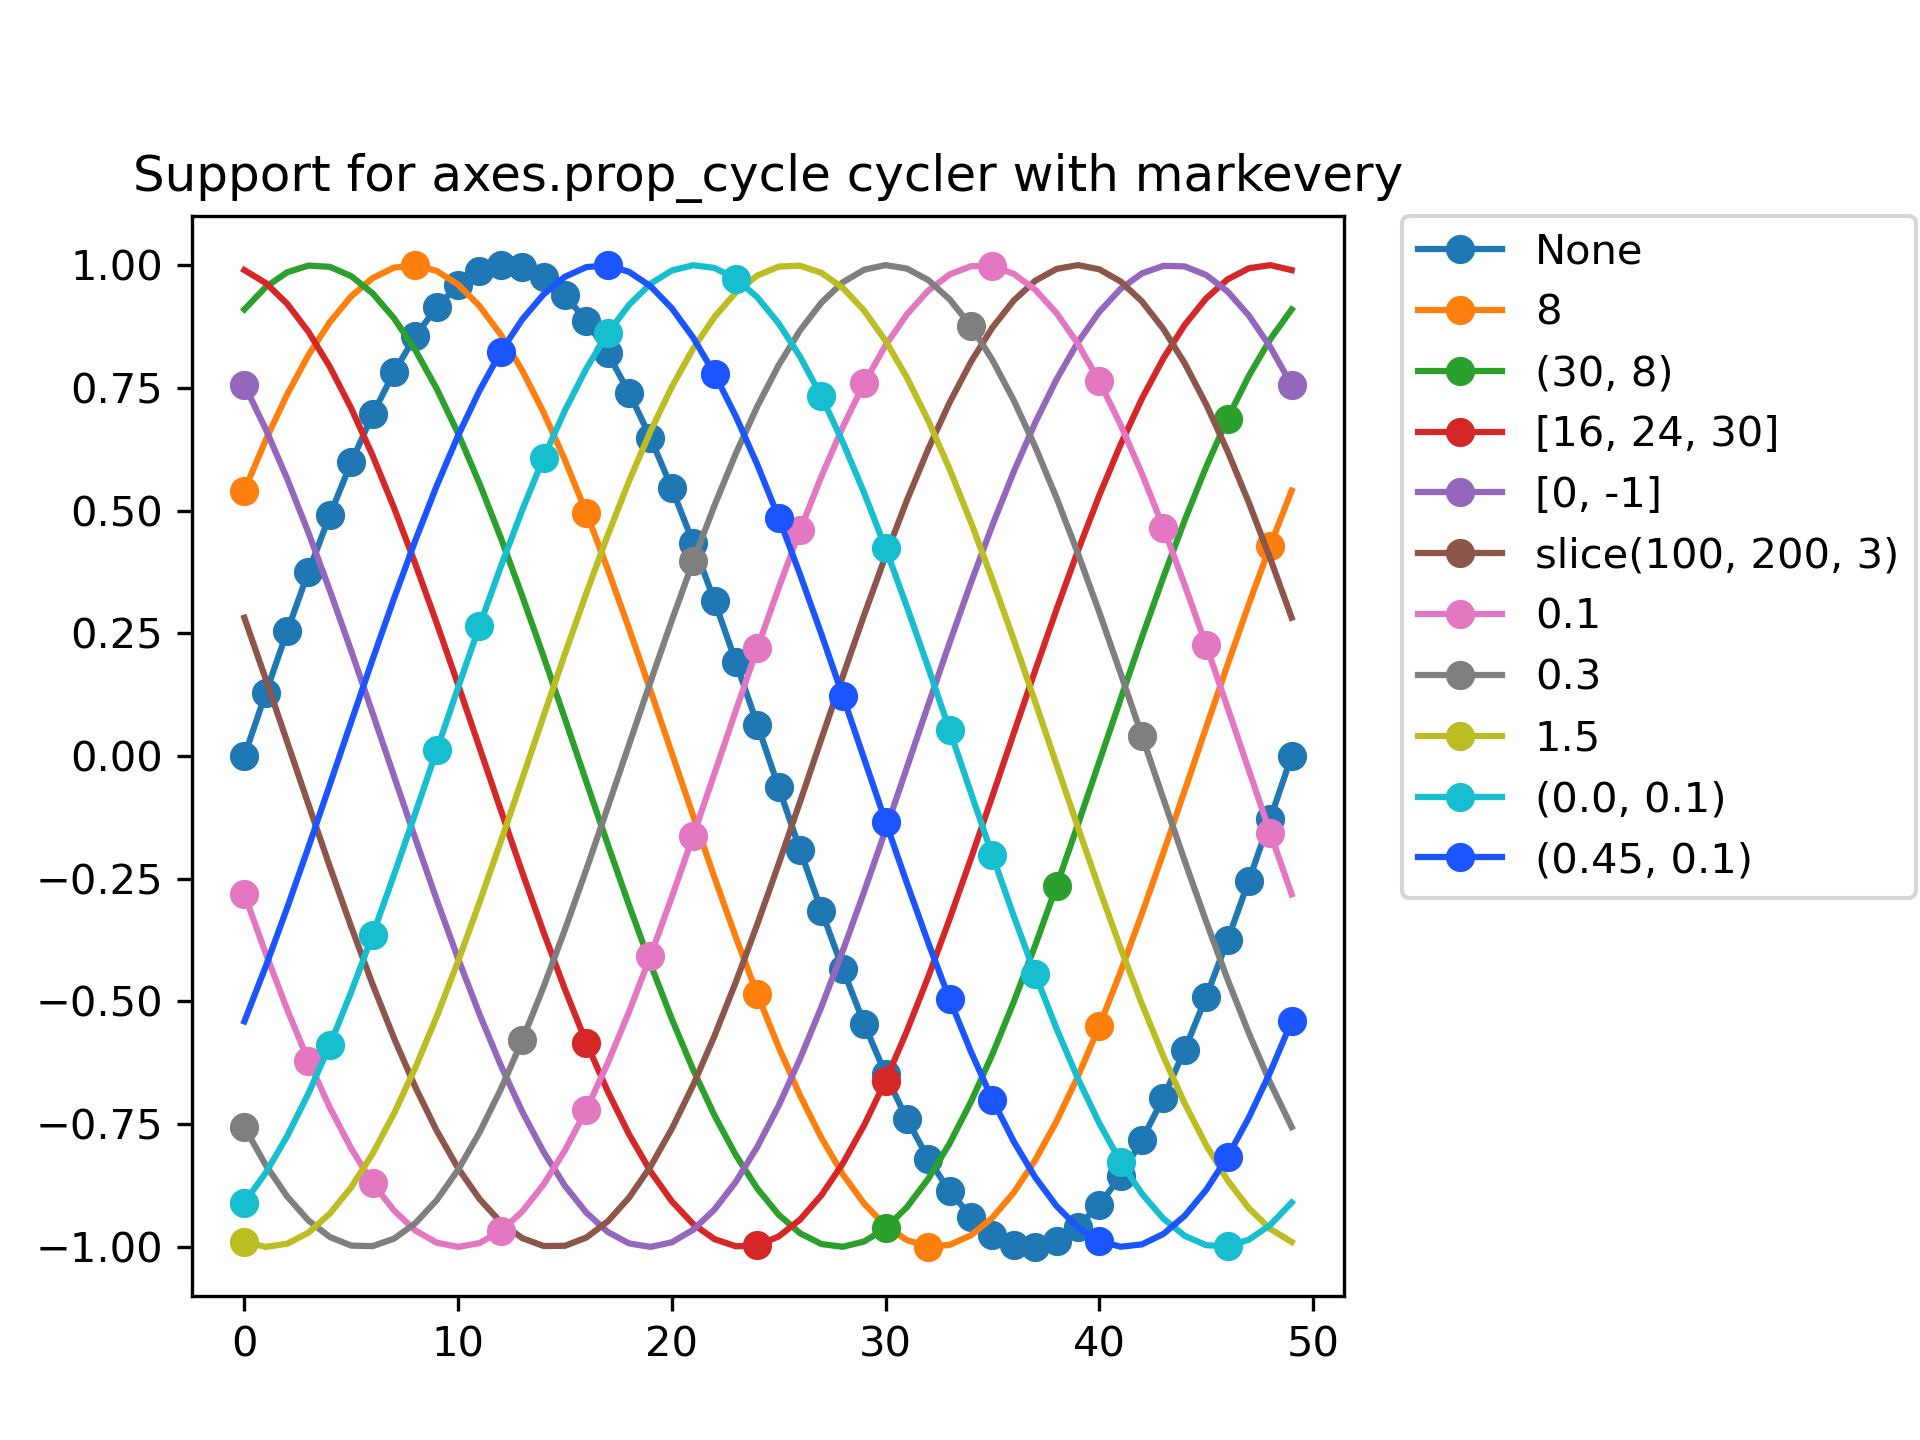
prop_cycle property markevery in rcParams
=========================================
This example demonstrates a working solution to issue #8576, providing full
support of the markevery property for axes.prop_cycle assignments through
rcParams. Makes use of the same list of markevery cases from the
:doc:`markevery demo
</gallery/lines_bars_and_markers/markevery_demo>`.
Renders a plot with shifted-sine curves along each column with
a unique markevery value for each sine curve.
"""
... from cycler import cycler
... import numpy as np
... import matplotlib as mpl
... import matplotlib.pyplot as plt
...
... # Define a list of markevery cases and color cases to plot
... cases = [None,
... 8,
... (30, 8),
... [16, 24, 30],
... [0, -1],
... slice(100, 200, 3),
... 0.1,
... 0.3,
... 1.5,
... (0.0, 0.1),
... (0.45, 0.1)]
...
... colors = ['#1f77b4',
... '#ff7f0e',
... '#2ca02c',
... '#d62728',
... '#9467bd',
... '#8c564b',
... '#e377c2',
... '#7f7f7f',
... '#bcbd22',
... '#17becf',
... '#1a55FF']
...
... # Configure rcParams axes.prop_cycle to simultaneously cycle cases and colors.
... mpl.rcParams['axes.prop_cycle'] = cycler(markevery=cases, color=colors)
...
... # Create data points and offsets
... x = np.linspace(0, 2 * np.pi)
... offsets = np.linspace(0, 2 * np.pi, 11, endpoint=False)
... yy = np.transpose([np.sin(x + phi) for phi in offsets])
...
... # Set the plot curve with markers and a title
... fig = plt.figure()
... ax = fig.add_axes([0.1, 0.1, 0.6, 0.75])
...
... for i in range(len(cases)):
... ax.plot(yy[:, i], marker='o', label=str(cases[i]))
... ax.legend(bbox_to_anchor=(1.05, 1), loc='upper left', borderaxespad=0.)
...
... plt.title('Support for axes.prop_cycle cycler with markevery')
...
... plt.show()
...