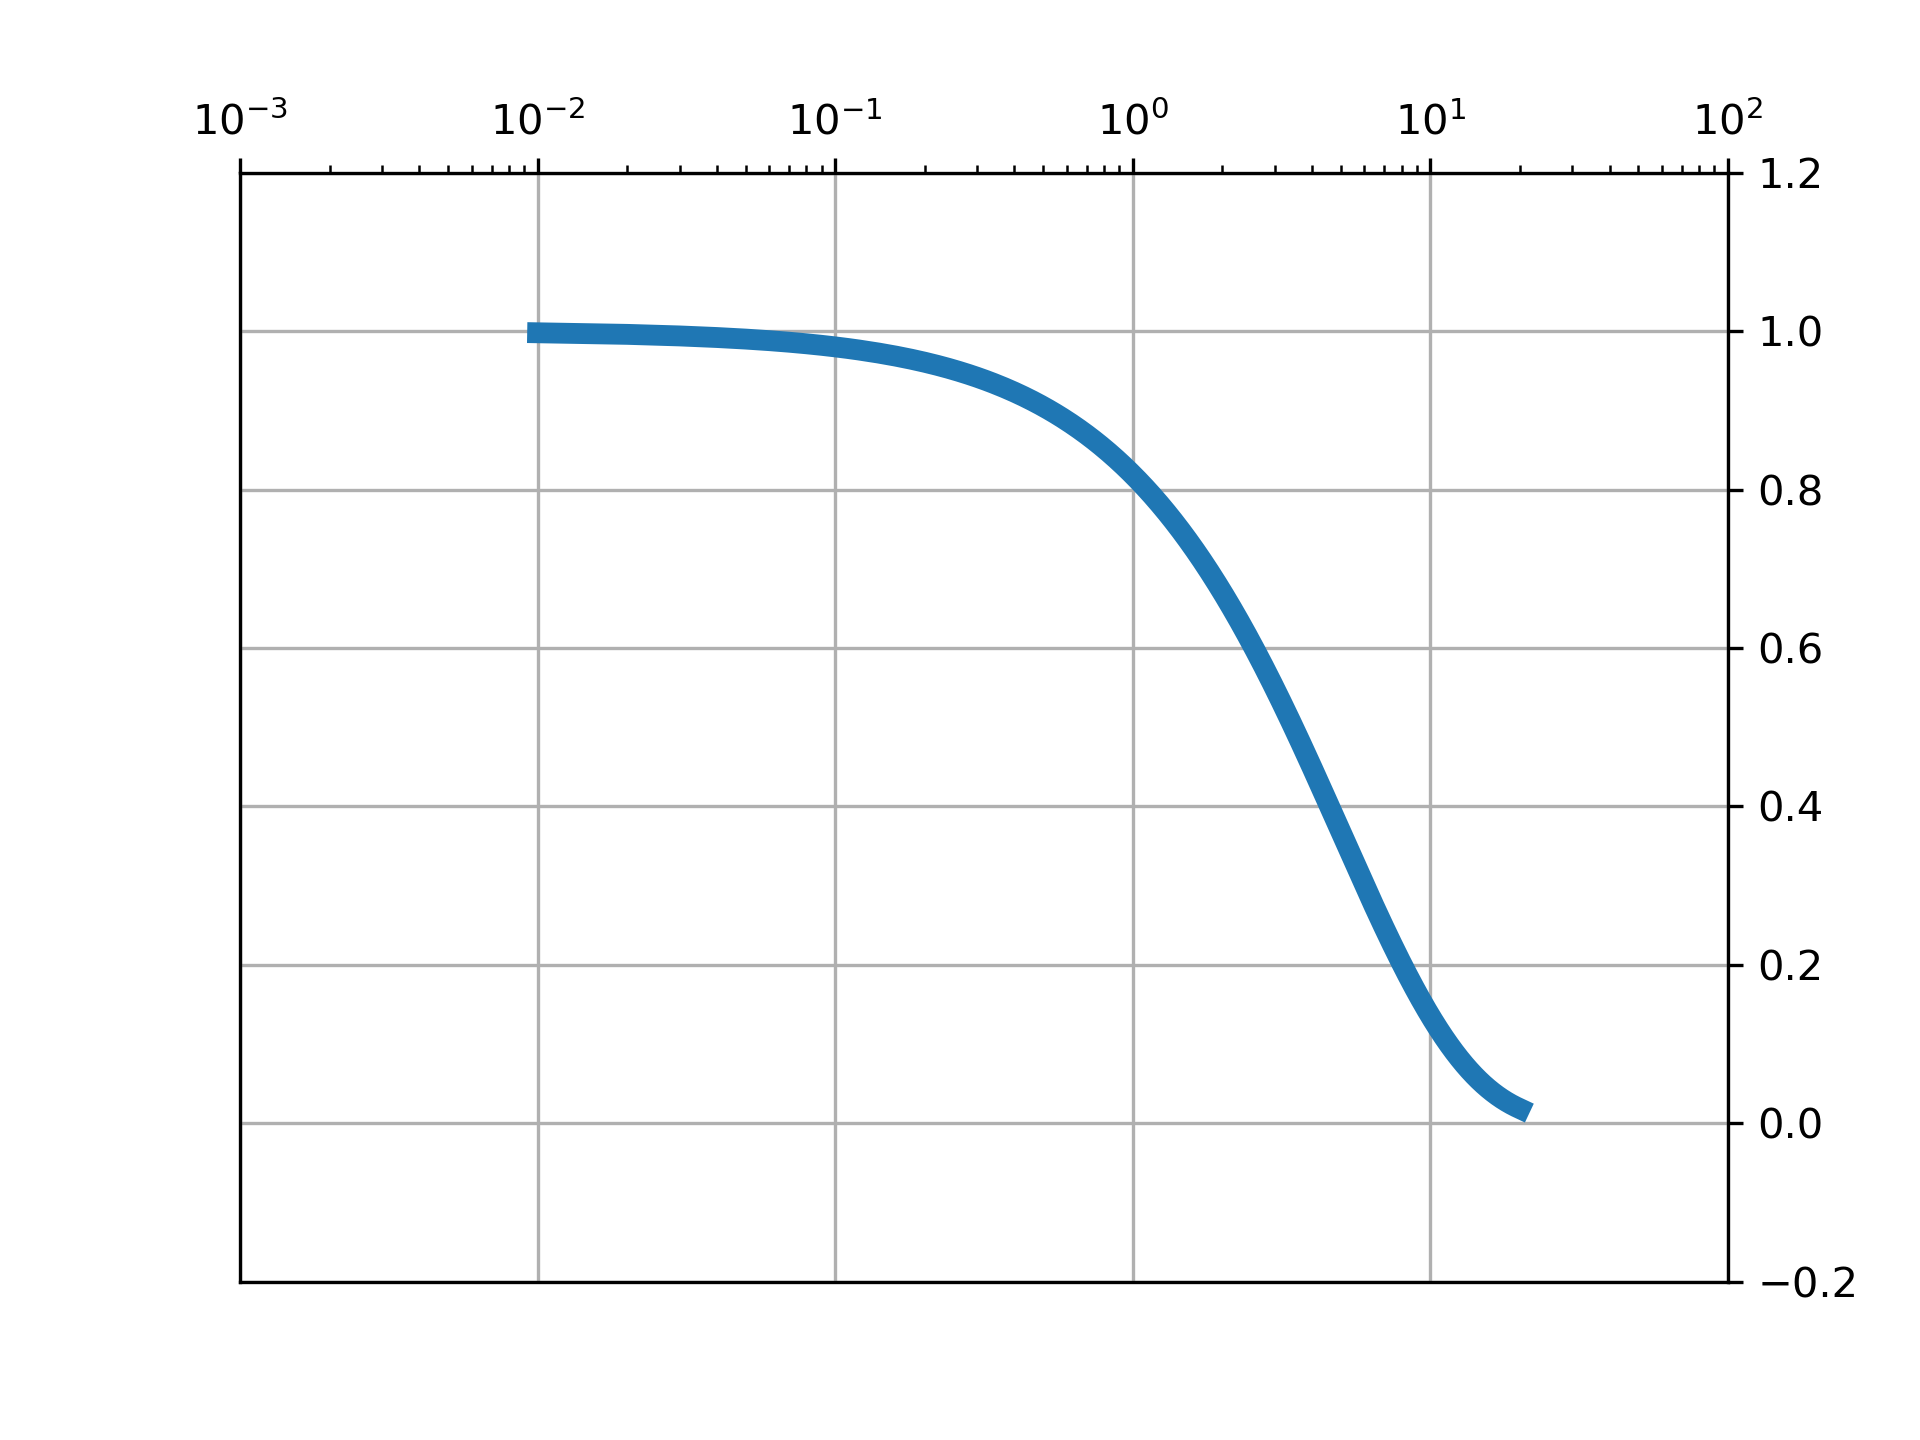
>>> """
========
Log Axis
========

This is an example of assigning a log-scale for the x-axis using
`~.axes.Axes.semilogx`.
"""
...
... import matplotlib.pyplot as plt
... import numpy as np
...
... fig, ax = plt.subplots()
...
... dt = 0.01
... t = np.arange(dt, 20.0, dt)
...
... ax.semilogx(t, np.exp(-t / 5.0))
... ax.grid()
...
... plt.show()
...