>>> """
=======
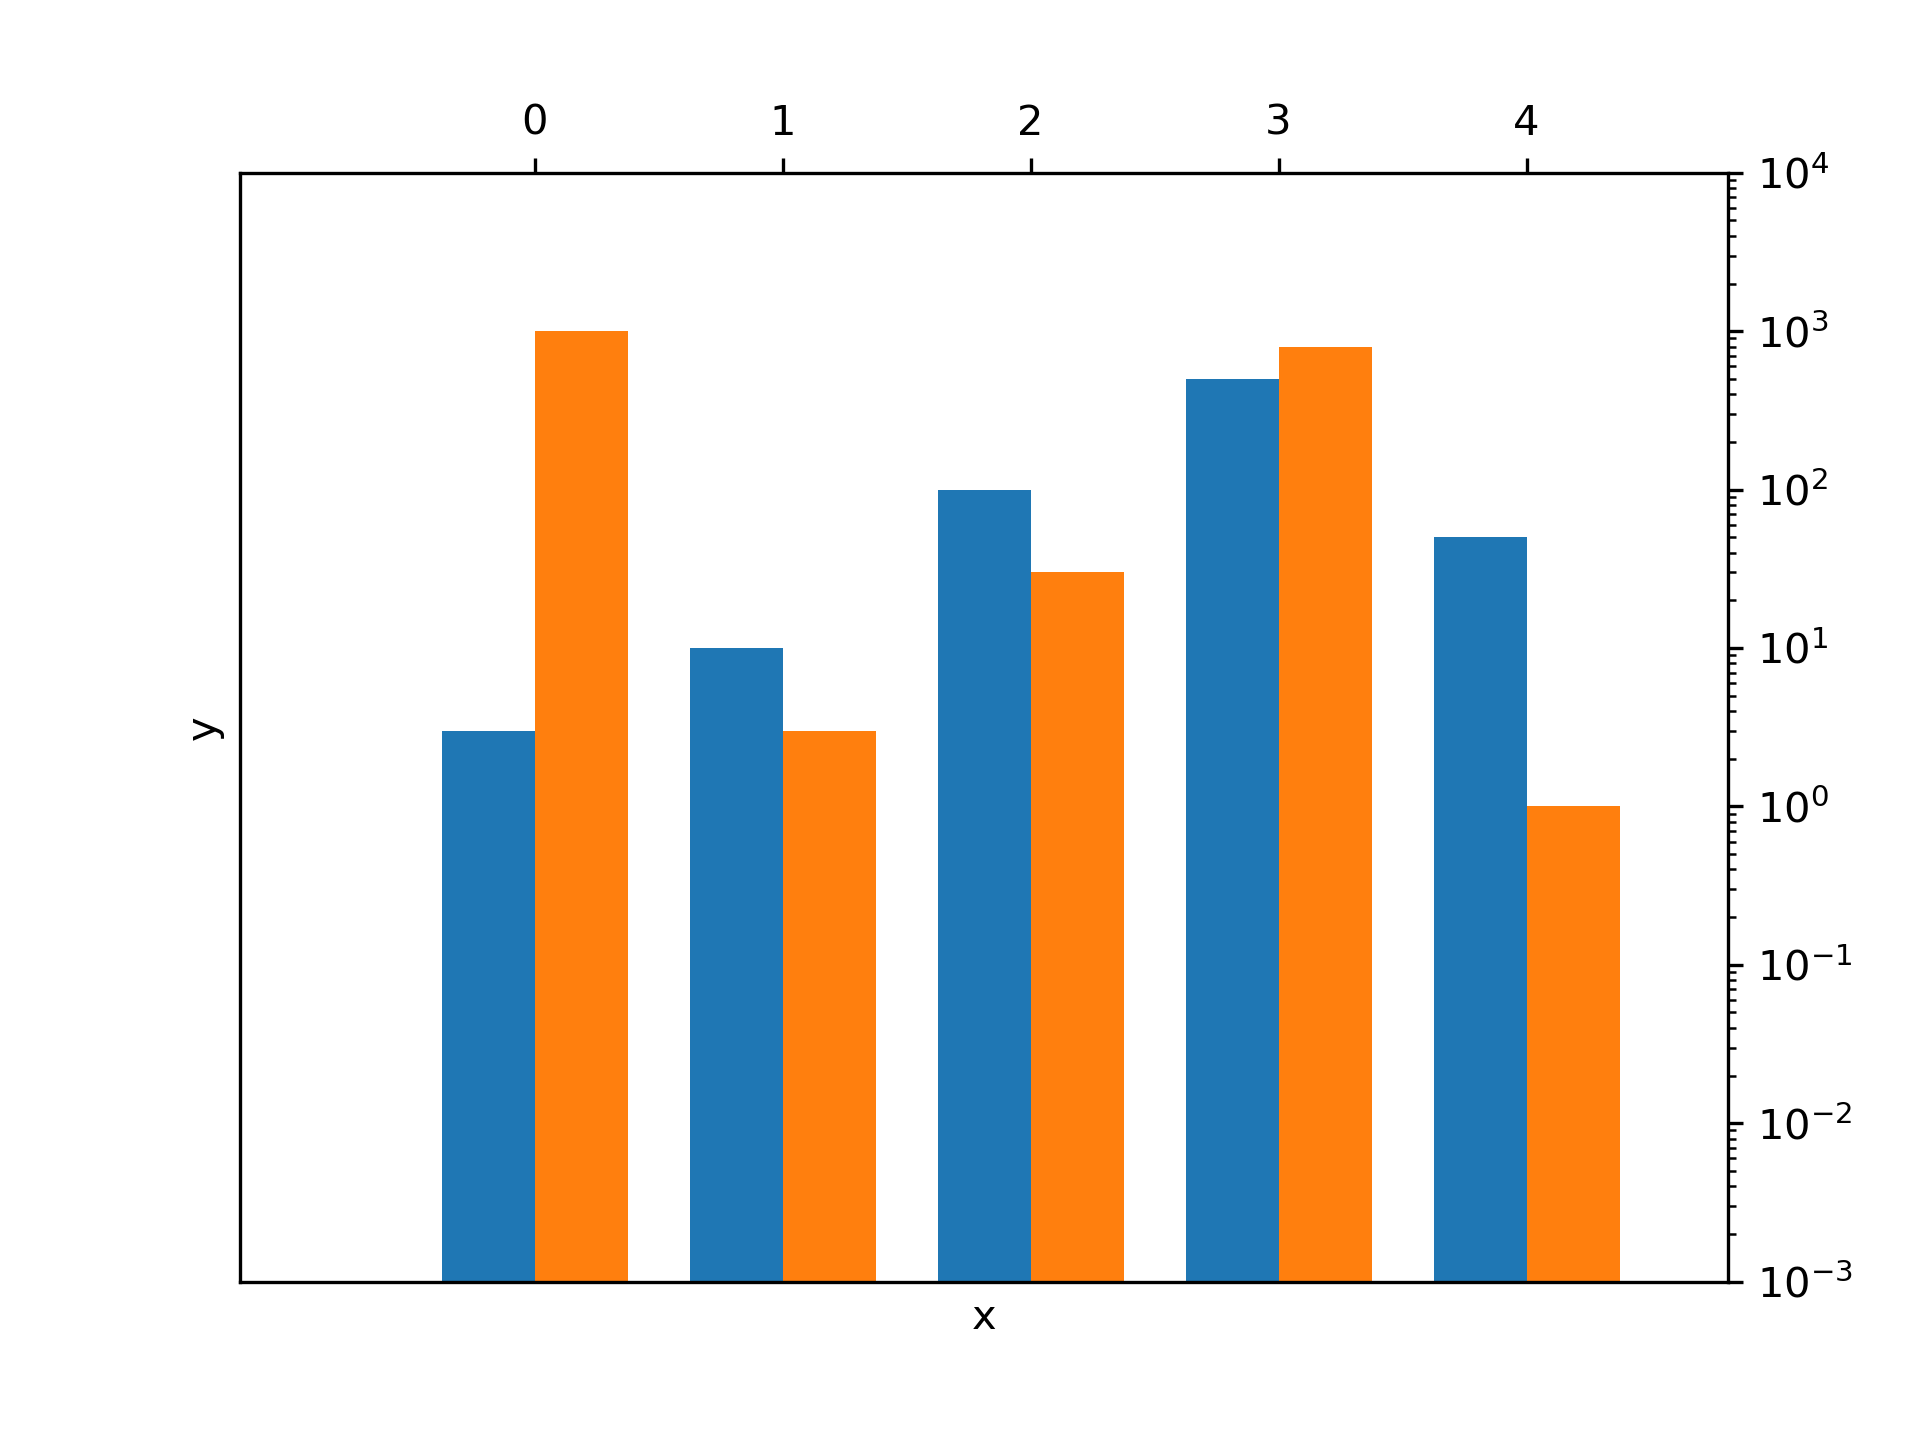
Log Bar
=======
Plotting a bar chart with a logarithmic y-axis.
"""
... import matplotlib.pyplot as plt
... import numpy as np
...
... data = ((3, 1000), (10, 3), (100, 30), (500, 800), (50, 1))
...
... dim = len(data[0])
... w = 0.75
... dimw = w / dim
...
... fig, ax = plt.subplots()
... x = np.arange(len(data))
... for i in range(len(data[0])):
... y = [d[i] for d in data]
... b = ax.bar(x + i * dimw, y, dimw, bottom=0.001)
...
... ax.set_xticks(x + dimw / 2, labels=map(str, x))
... ax.set_yscale('log')
...
... ax.set_xlabel('x')
... ax.set_ylabel('y')
...
... plt.show()
...