>>> """
===============
Line Collection
===============
Plotting lines with Matplotlib.
`~matplotlib.collections.LineCollection` allows one to plot multiple
lines on a figure. Below we show off some of its properties.
"""
...
... import matplotlib.pyplot as plt
... from matplotlib.collections import LineCollection
... from matplotlib import colors as mcolors
...
... import numpy as np
...
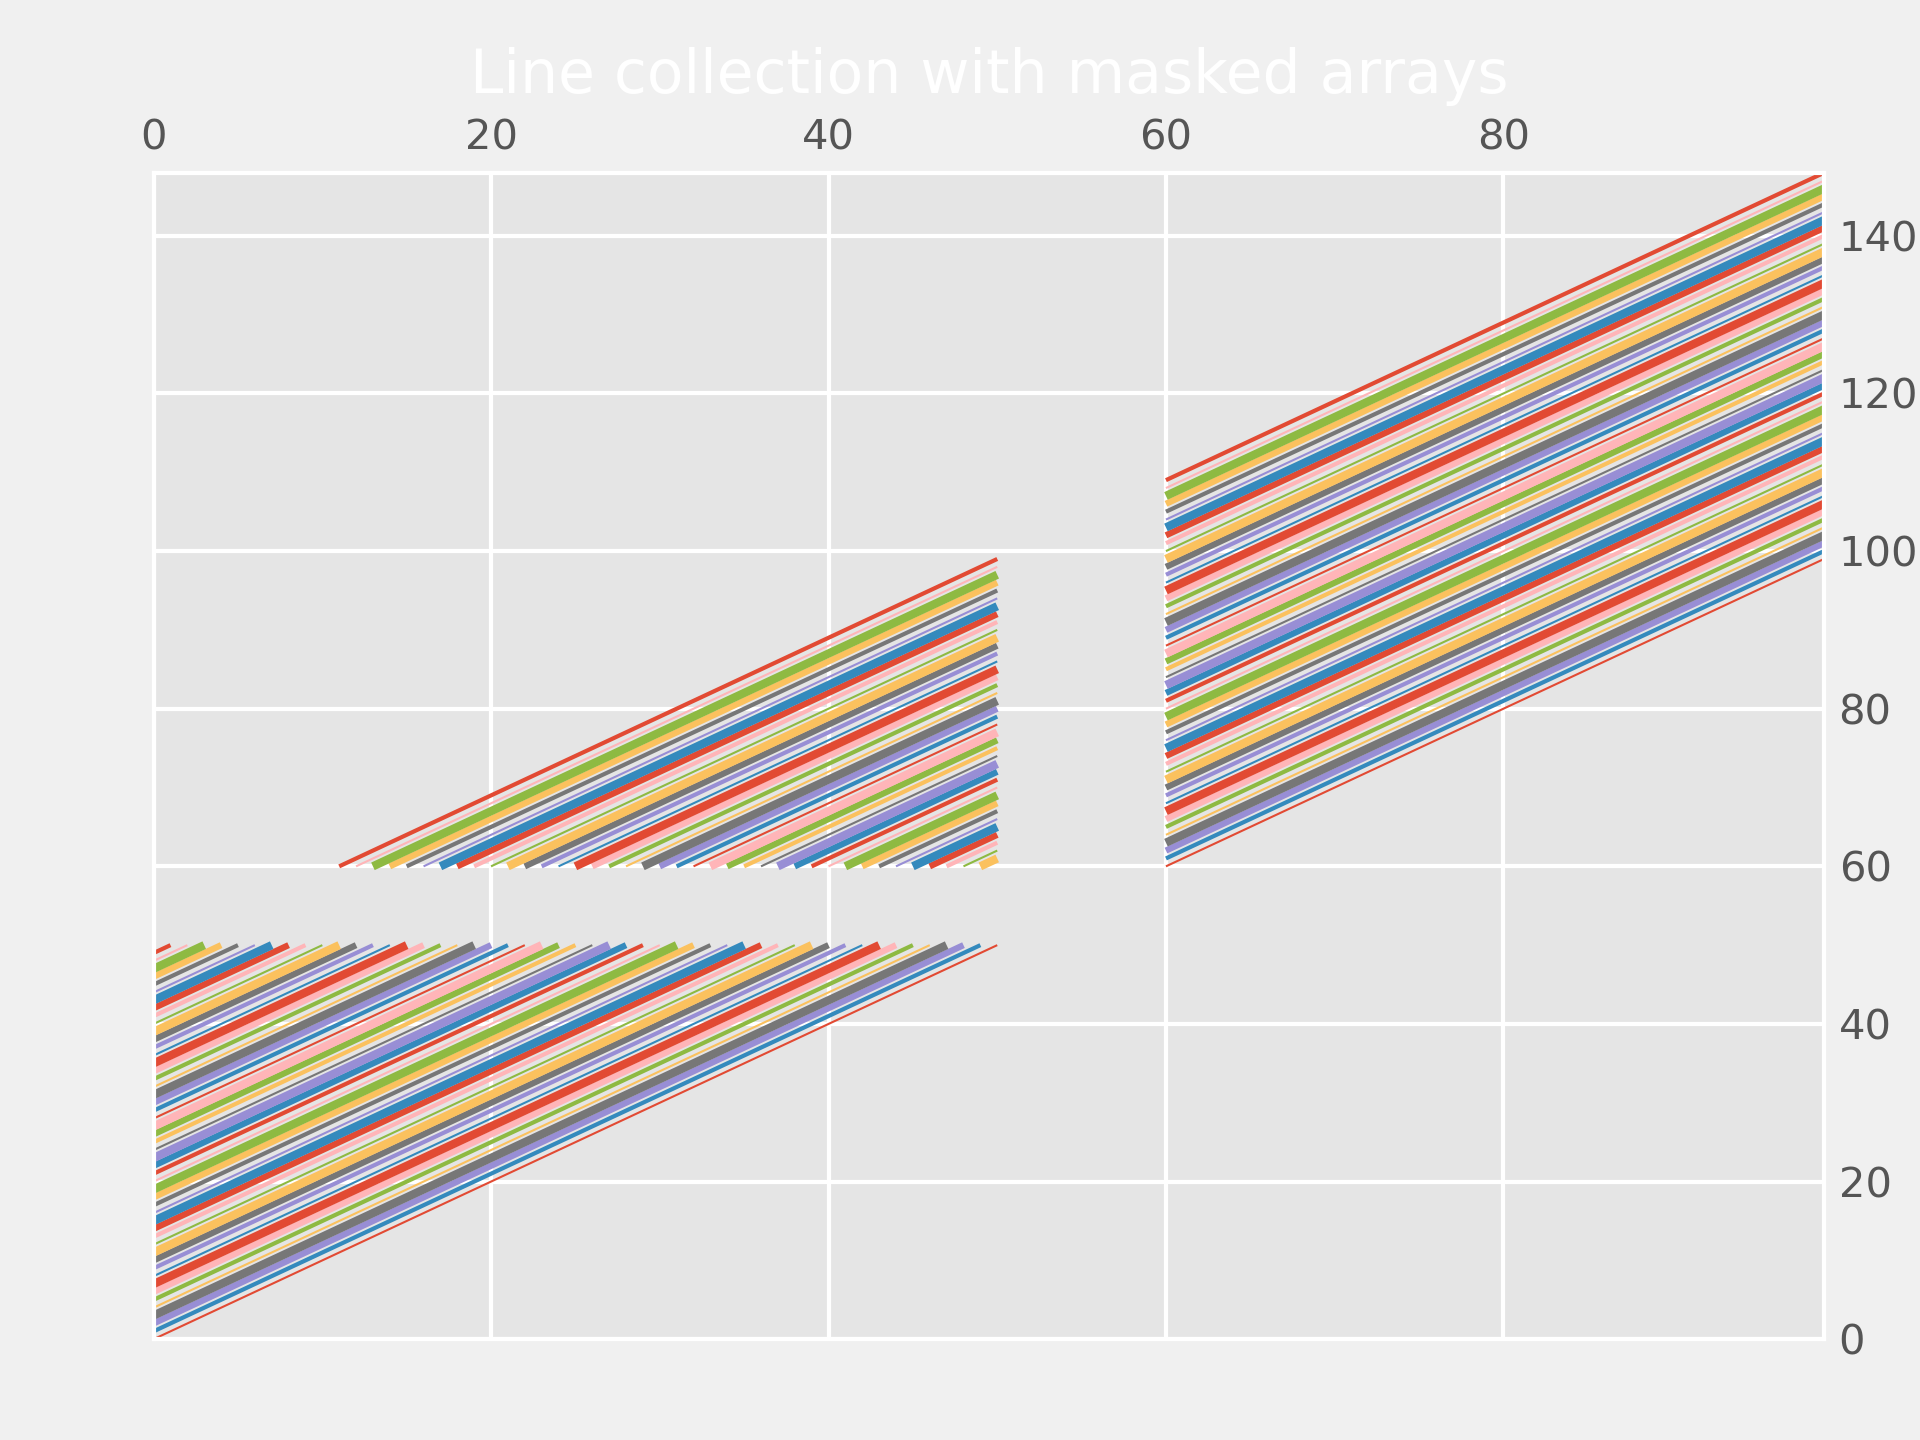
... # In order to efficiently plot many lines in a single set of axes,
... # Matplotlib has the ability to add the lines all at once. Here is a
... # simple example showing how it is done.
...
... x = np.arange(100)
... # Here are many sets of y to plot vs. x
... ys = x[:50, np.newaxis] + x[np.newaxis, :]
...
... segs = np.zeros((50, 100, 2))
... segs[:, :, 1] = ys
... segs[:, :, 0] = x
...
... # Mask some values to test masked array support:
... segs = np.ma.masked_where((segs > 50) & (segs < 60), segs)
...
... # We need to set the plot limits.
... fig, ax = plt.subplots()
... ax.set_xlim(x.min(), x.max())
... ax.set_ylim(ys.min(), ys.max())
...
... # *colors* is sequence of rgba tuples.
... # *linestyle* is a string or dash tuple. Legal string values are
... # solid|dashed|dashdot|dotted. The dash tuple is (offset, onoffseq) where
... # onoffseq is an even length tuple of on and off ink in points. If linestyle
... # is omitted, 'solid' is used.
... # See `matplotlib.collections.LineCollection` for more information.
... colors = [mcolors.to_rgba(c)
... for c in plt.rcParams['axes.prop_cycle'].by_key()['color']]
...
... line_segments = LineCollection(segs, linewidths=(0.5, 1, 1.5, 2),
... colors=colors, linestyle='solid')
... ax.add_collection(line_segments)
... ax.set_title('Line collection with masked arrays')
... plt.show()
...
... ###############################################################################
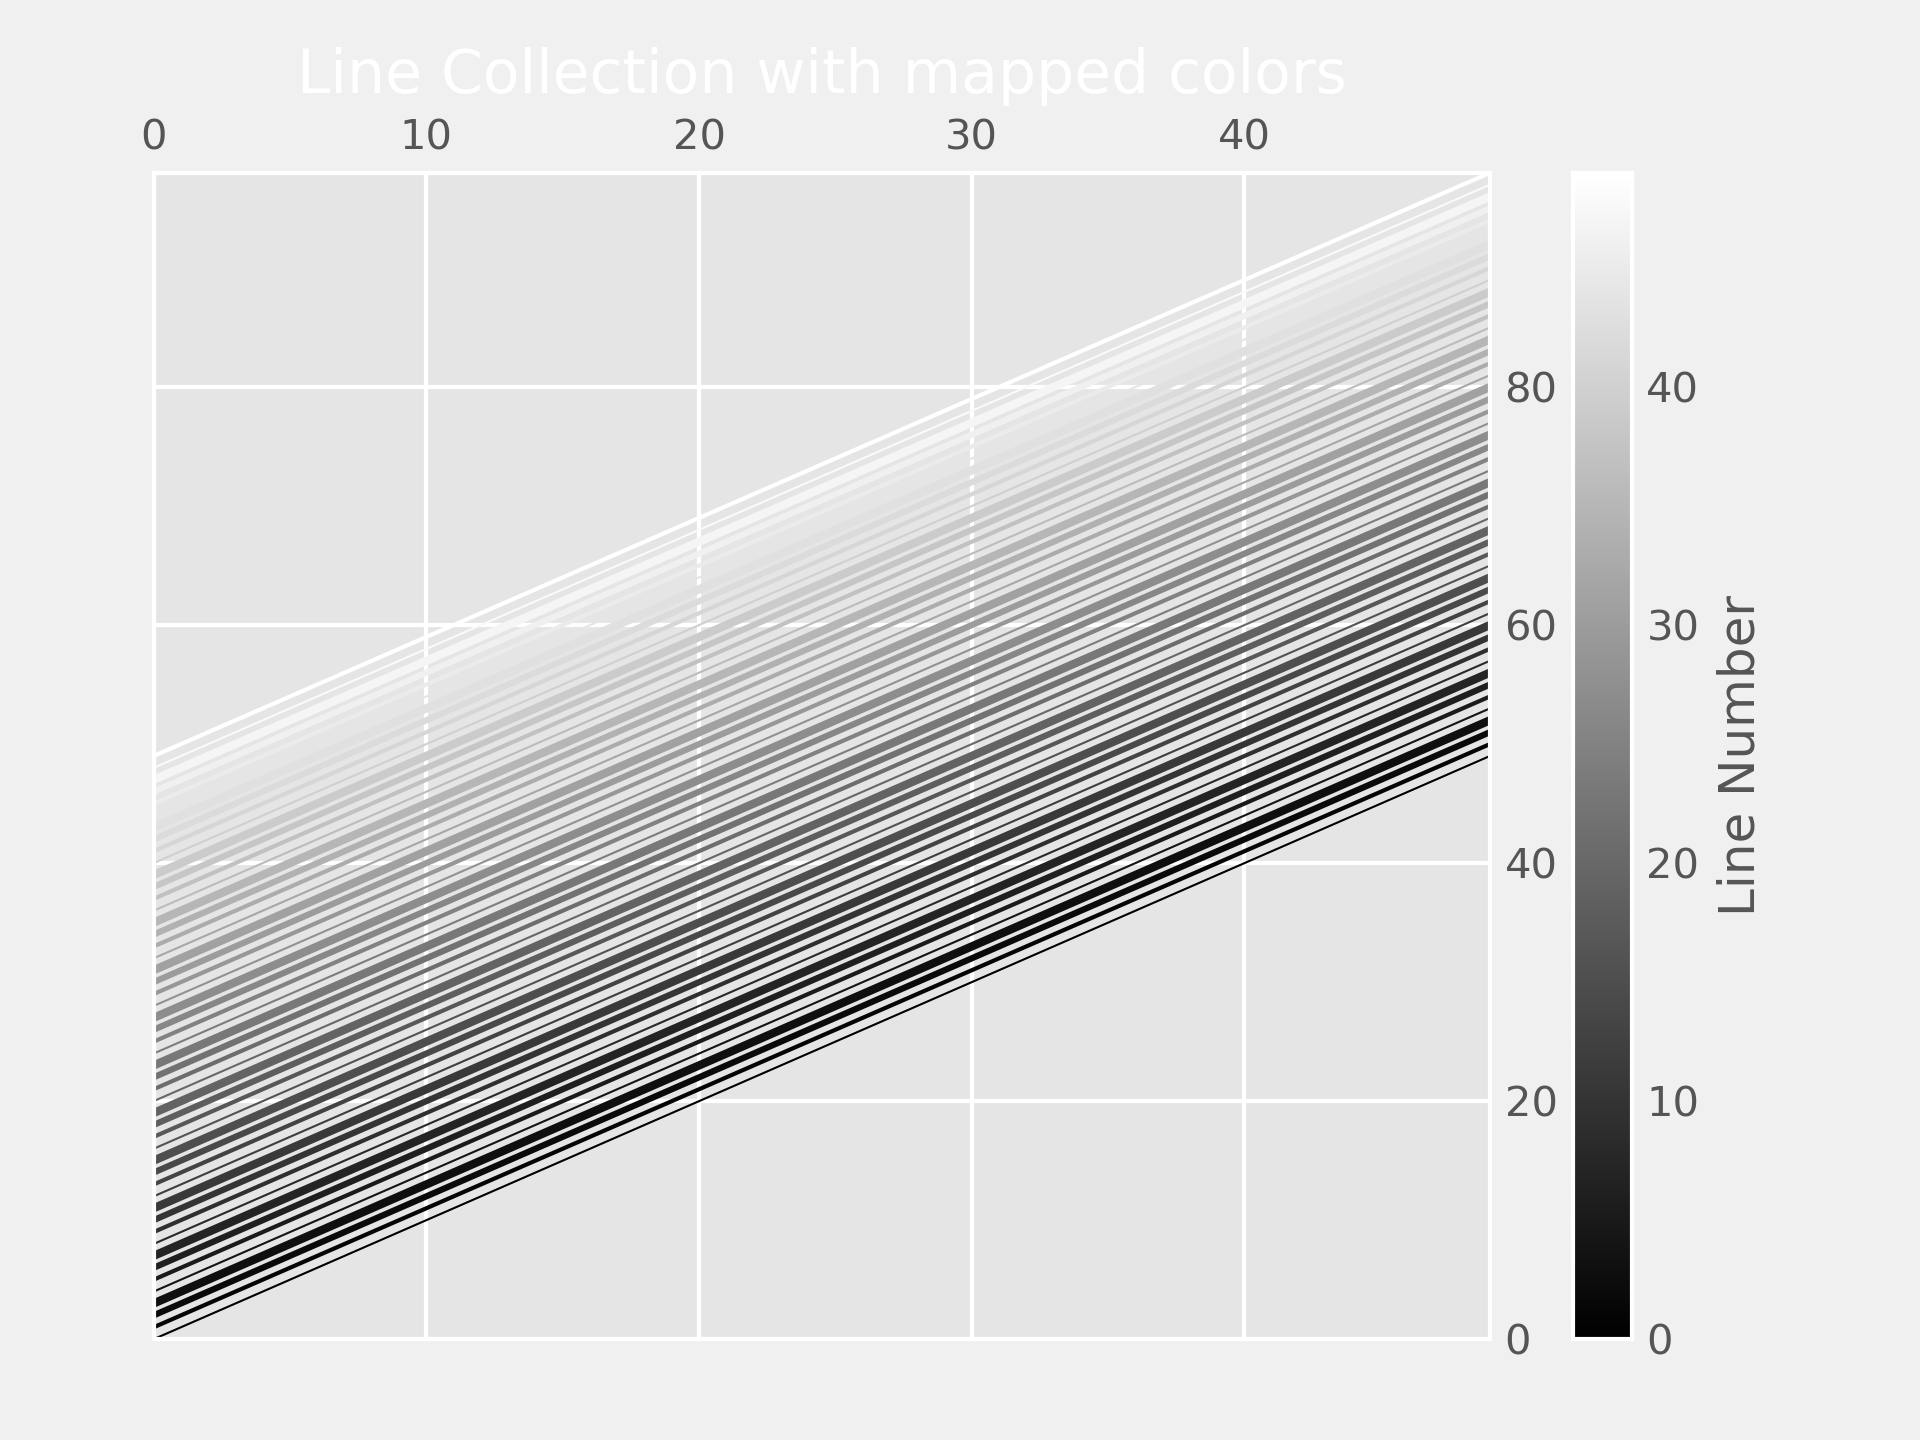
... # In order to efficiently plot many lines in a single set of axes,
... # Matplotlib has the ability to add the lines all at once. Here is a
... # simple example showing how it is done.
...
... N = 50
... x = np.arange(N)
... # Here are many sets of y to plot vs. x
... ys = [x + i for i in x]
...
... # We need to set the plot limits, they will not autoscale
... fig, ax = plt.subplots()
... ax.set_xlim(np.min(x), np.max(x))
... ax.set_ylim(np.min(ys), np.max(ys))
...
... # colors is sequence of rgba tuples
... # linestyle is a string or dash tuple. Legal string values are
... # solid|dashed|dashdot|dotted. The dash tuple is (offset, onoffseq)
... # where onoffseq is an even length tuple of on and off ink in points.
... # If linestyle is omitted, 'solid' is used
... # See `matplotlib.collections.LineCollection` for more information
...
... # Make a sequence of (x, y) pairs.
... line_segments = LineCollection([np.column_stack([x, y]) for y in ys],
... linewidths=(0.5, 1, 1.5, 2),
... linestyles='solid')
... line_segments.set_array(x)
... ax.add_collection(line_segments)
... axcb = fig.colorbar(line_segments)
... axcb.set_label('Line Number')
... ax.set_title('Line Collection with mapped colors')
... plt.sci(line_segments) # This allows interactive changing of the colormap.
... plt.show()
...
... #############################################################################
... #
... # .. admonition:: References
... #
... # The use of the following functions, methods, classes and modules is shown
... # in this example:
... #
... # - `matplotlib.collections`
... # - `matplotlib.collections.LineCollection`
... # - `matplotlib.cm.ScalarMappable.set_array`
... # - `matplotlib.axes.Axes.add_collection`
... # - `matplotlib.figure.Figure.colorbar` / `matplotlib.pyplot.colorbar`
... # - `matplotlib.pyplot.sci`
...