>>> """
============
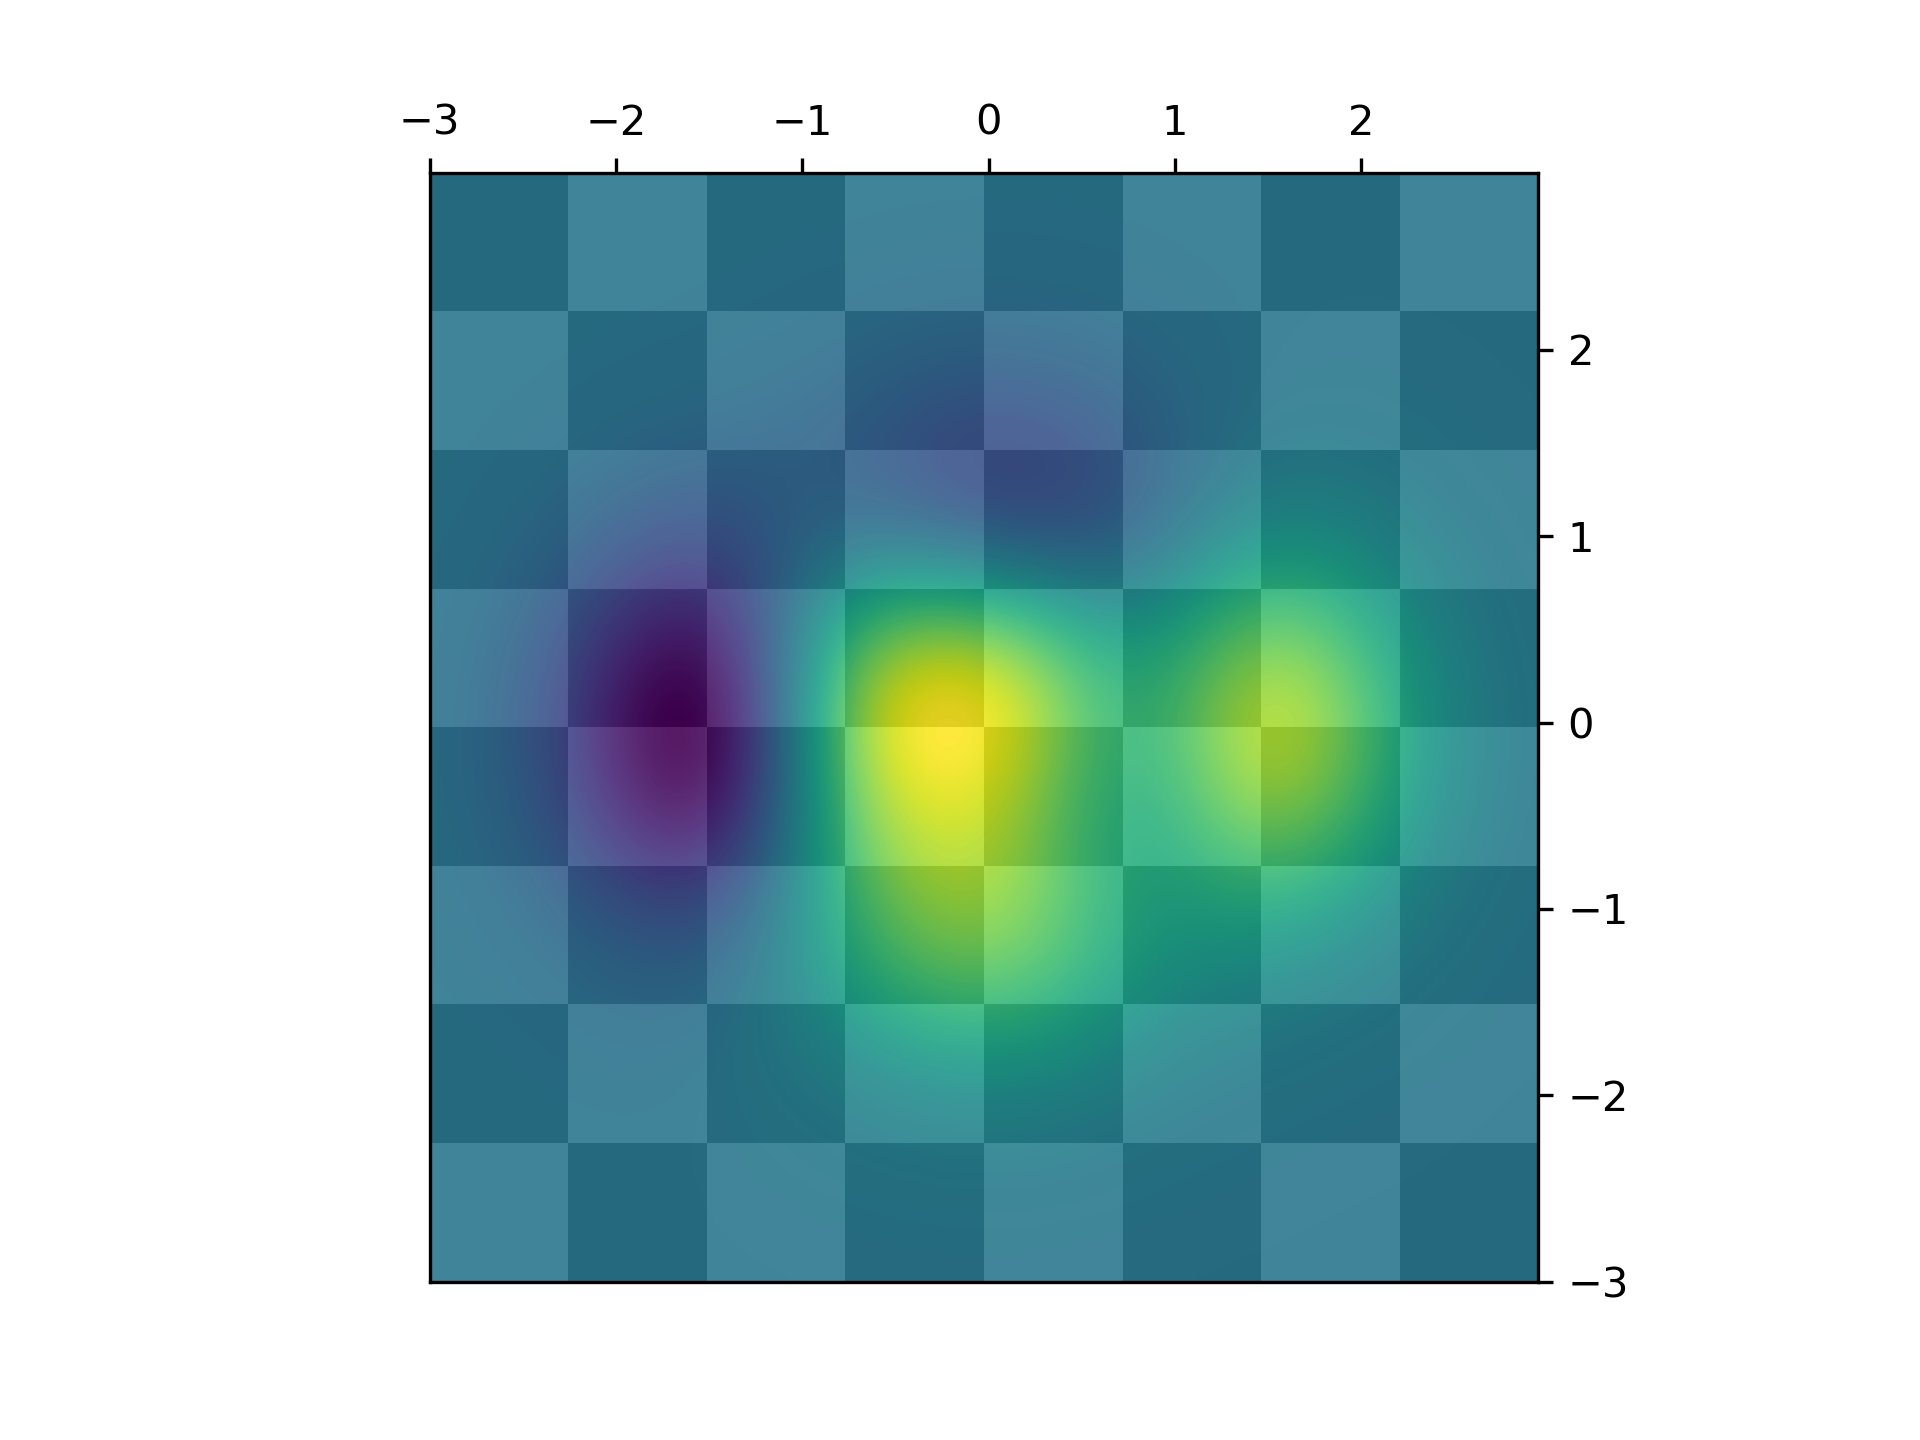
Layer Images
============
Layer images above one another using alpha blending
"""
... import matplotlib.pyplot as plt
... import numpy as np
...
...
... def func3(x, y):
... return (1 - x / 2 + x**5 + y**3) * np.exp(-(x**2 + y**2))
...
...
... # make these smaller to increase the resolution
... dx, dy = 0.05, 0.05
...
... x = np.arange(-3.0, 3.0, dx)
... y = np.arange(-3.0, 3.0, dy)
... X, Y = np.meshgrid(x, y)
...
... # when layering multiple images, the images need to have the same
... # extent. This does not mean they need to have the same shape, but
... # they both need to render to the same coordinate system determined by
... # xmin, xmax, ymin, ymax. Note if you use different interpolations
... # for the images their apparent extent could be different due to
... # interpolation edge effects
...
... extent = np.min(x), np.max(x), np.min(y), np.max(y)
... fig = plt.figure(frameon=False)
...
... Z1 = np.add.outer(range(8), range(8)) % 2 # chessboard
... im1 = plt.imshow(Z1, cmap=plt.cm.gray, interpolation='nearest',
... extent=extent)
...
... Z2 = func3(X, Y)
...
... im2 = plt.imshow(Z2, cmap=plt.cm.viridis, alpha=.9, interpolation='bilinear',
... extent=extent)
...
... plt.show()
...
... #############################################################################
... #
... # .. admonition:: References
... #
... # The use of the following functions, methods, classes and modules is shown
... # in this example:
... #
... # - `matplotlib.axes.Axes.imshow` / `matplotlib.pyplot.imshow`
...