>>> """
==================
Labelling subplots
==================
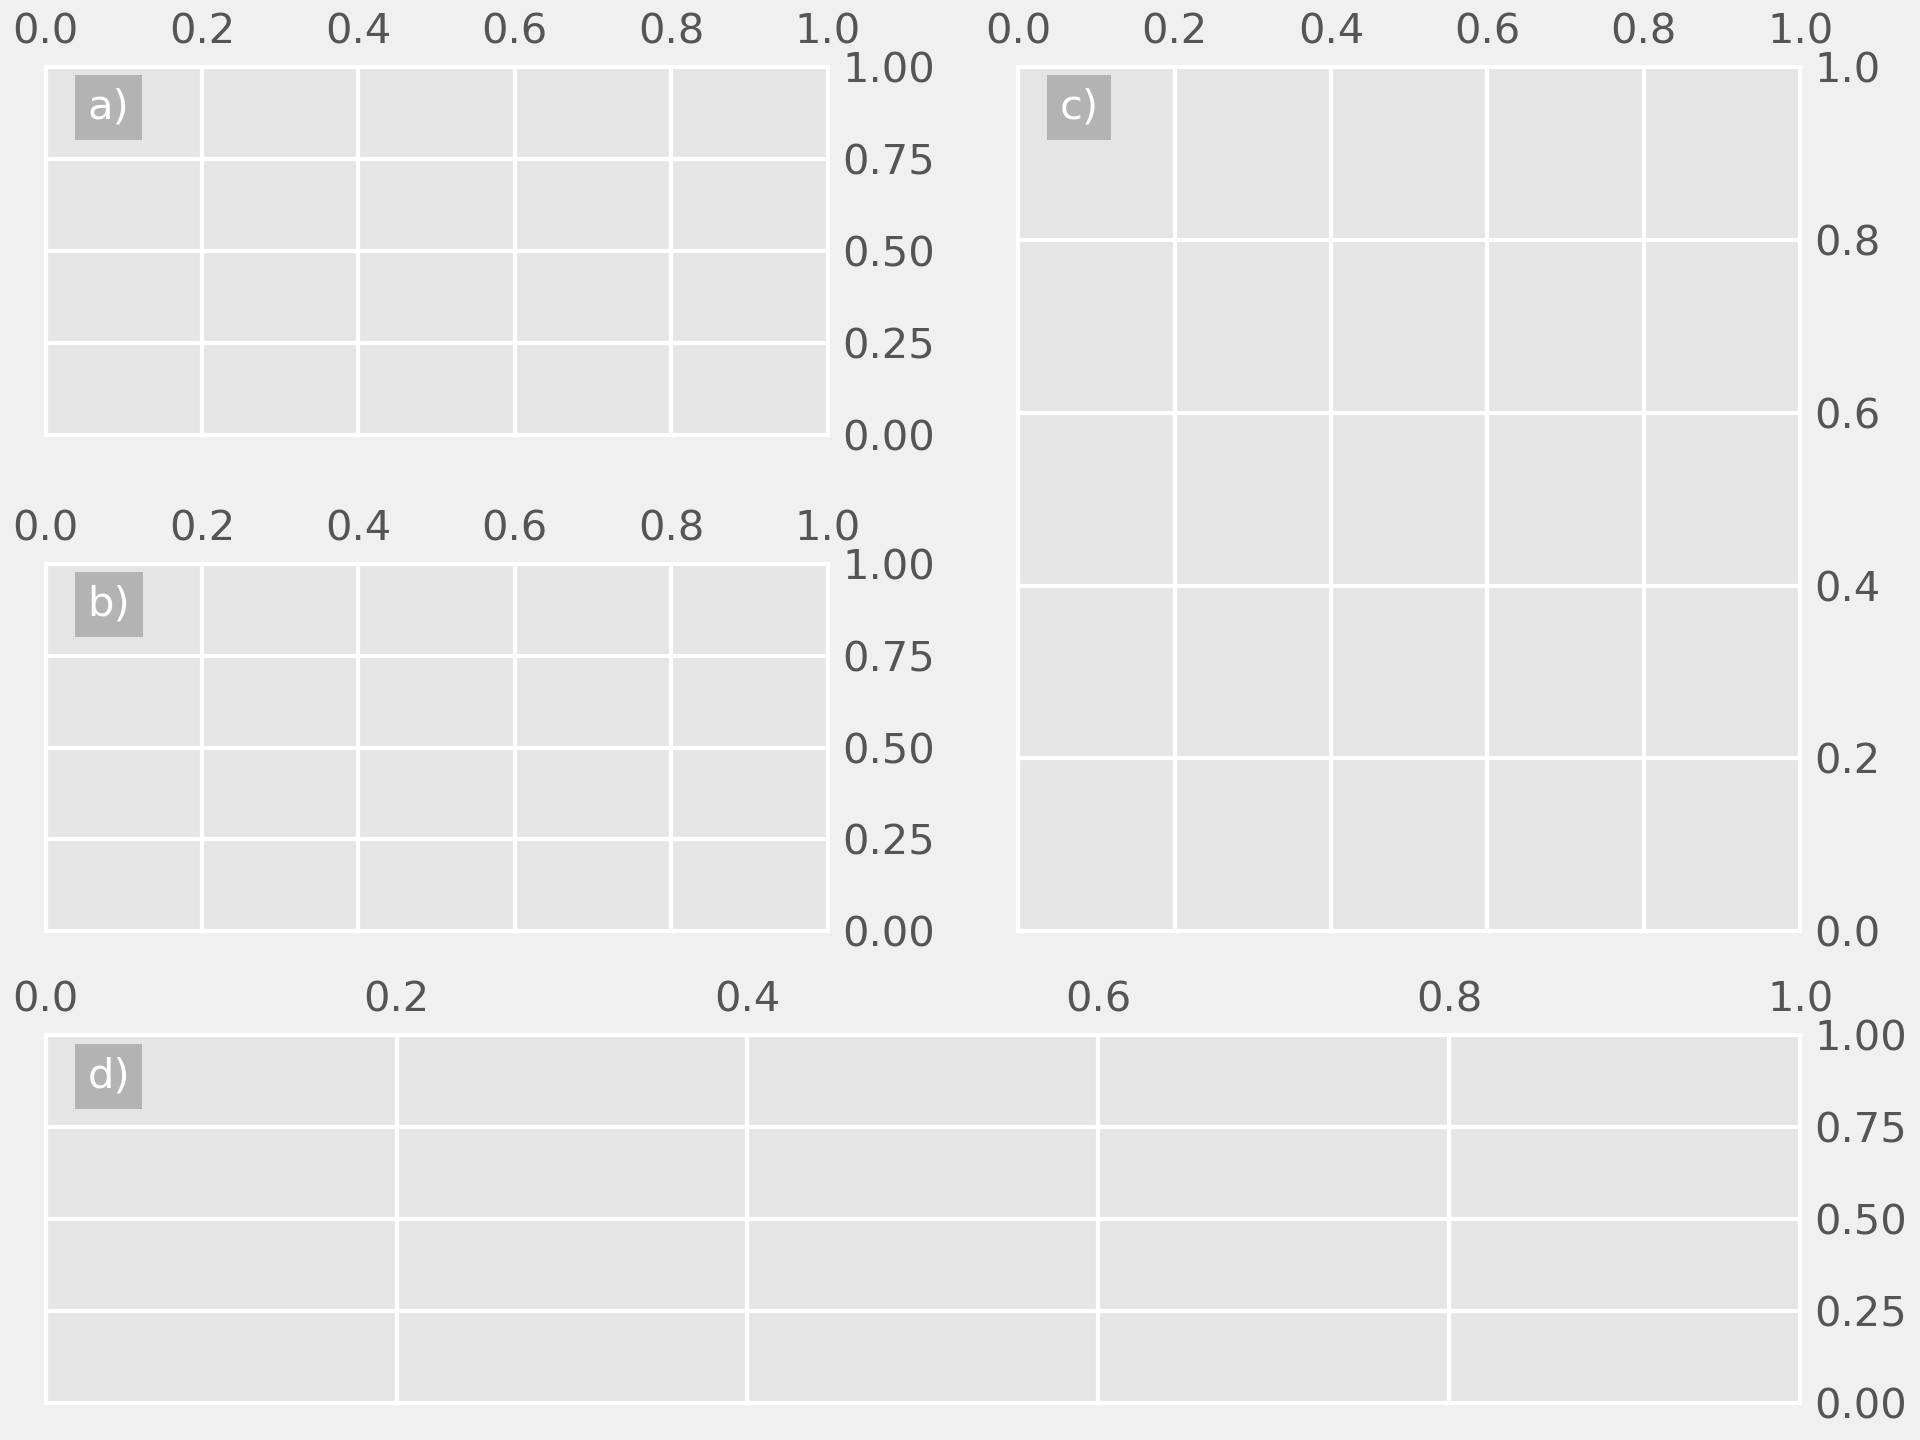
Labelling subplots is relatively straightforward, and varies,
so Matplotlib does not have a general method for doing this.
Simplest is putting the label inside the axes. Note, here
we use `.pyplot.subplot_mosaic`, and use the subplot labels
as keys for the subplots, which is a nice convenience. However,
the same method works with `.pyplot.subplots` or keys that are
different than what you want to label the subplot with.
"""
...
... import matplotlib.pyplot as plt
... import matplotlib.transforms as mtransforms
...
... fig, axs = plt.subplot_mosaic([['a)', 'c)'], ['b)', 'c)'], ['d)', 'd)']],
... constrained_layout=True)
...
... for label, ax in axs.items():
... # label physical distance in and down:
... trans = mtransforms.ScaledTranslation(10/72, -5/72, fig.dpi_scale_trans)
... ax.text(0.0, 1.0, label, transform=ax.transAxes + trans,
... fontsize='medium', verticalalignment='top', fontfamily='serif',
... bbox=dict(facecolor='0.7', edgecolor='none', pad=3.0))
...
... plt.show()
...
... ##############################################################################
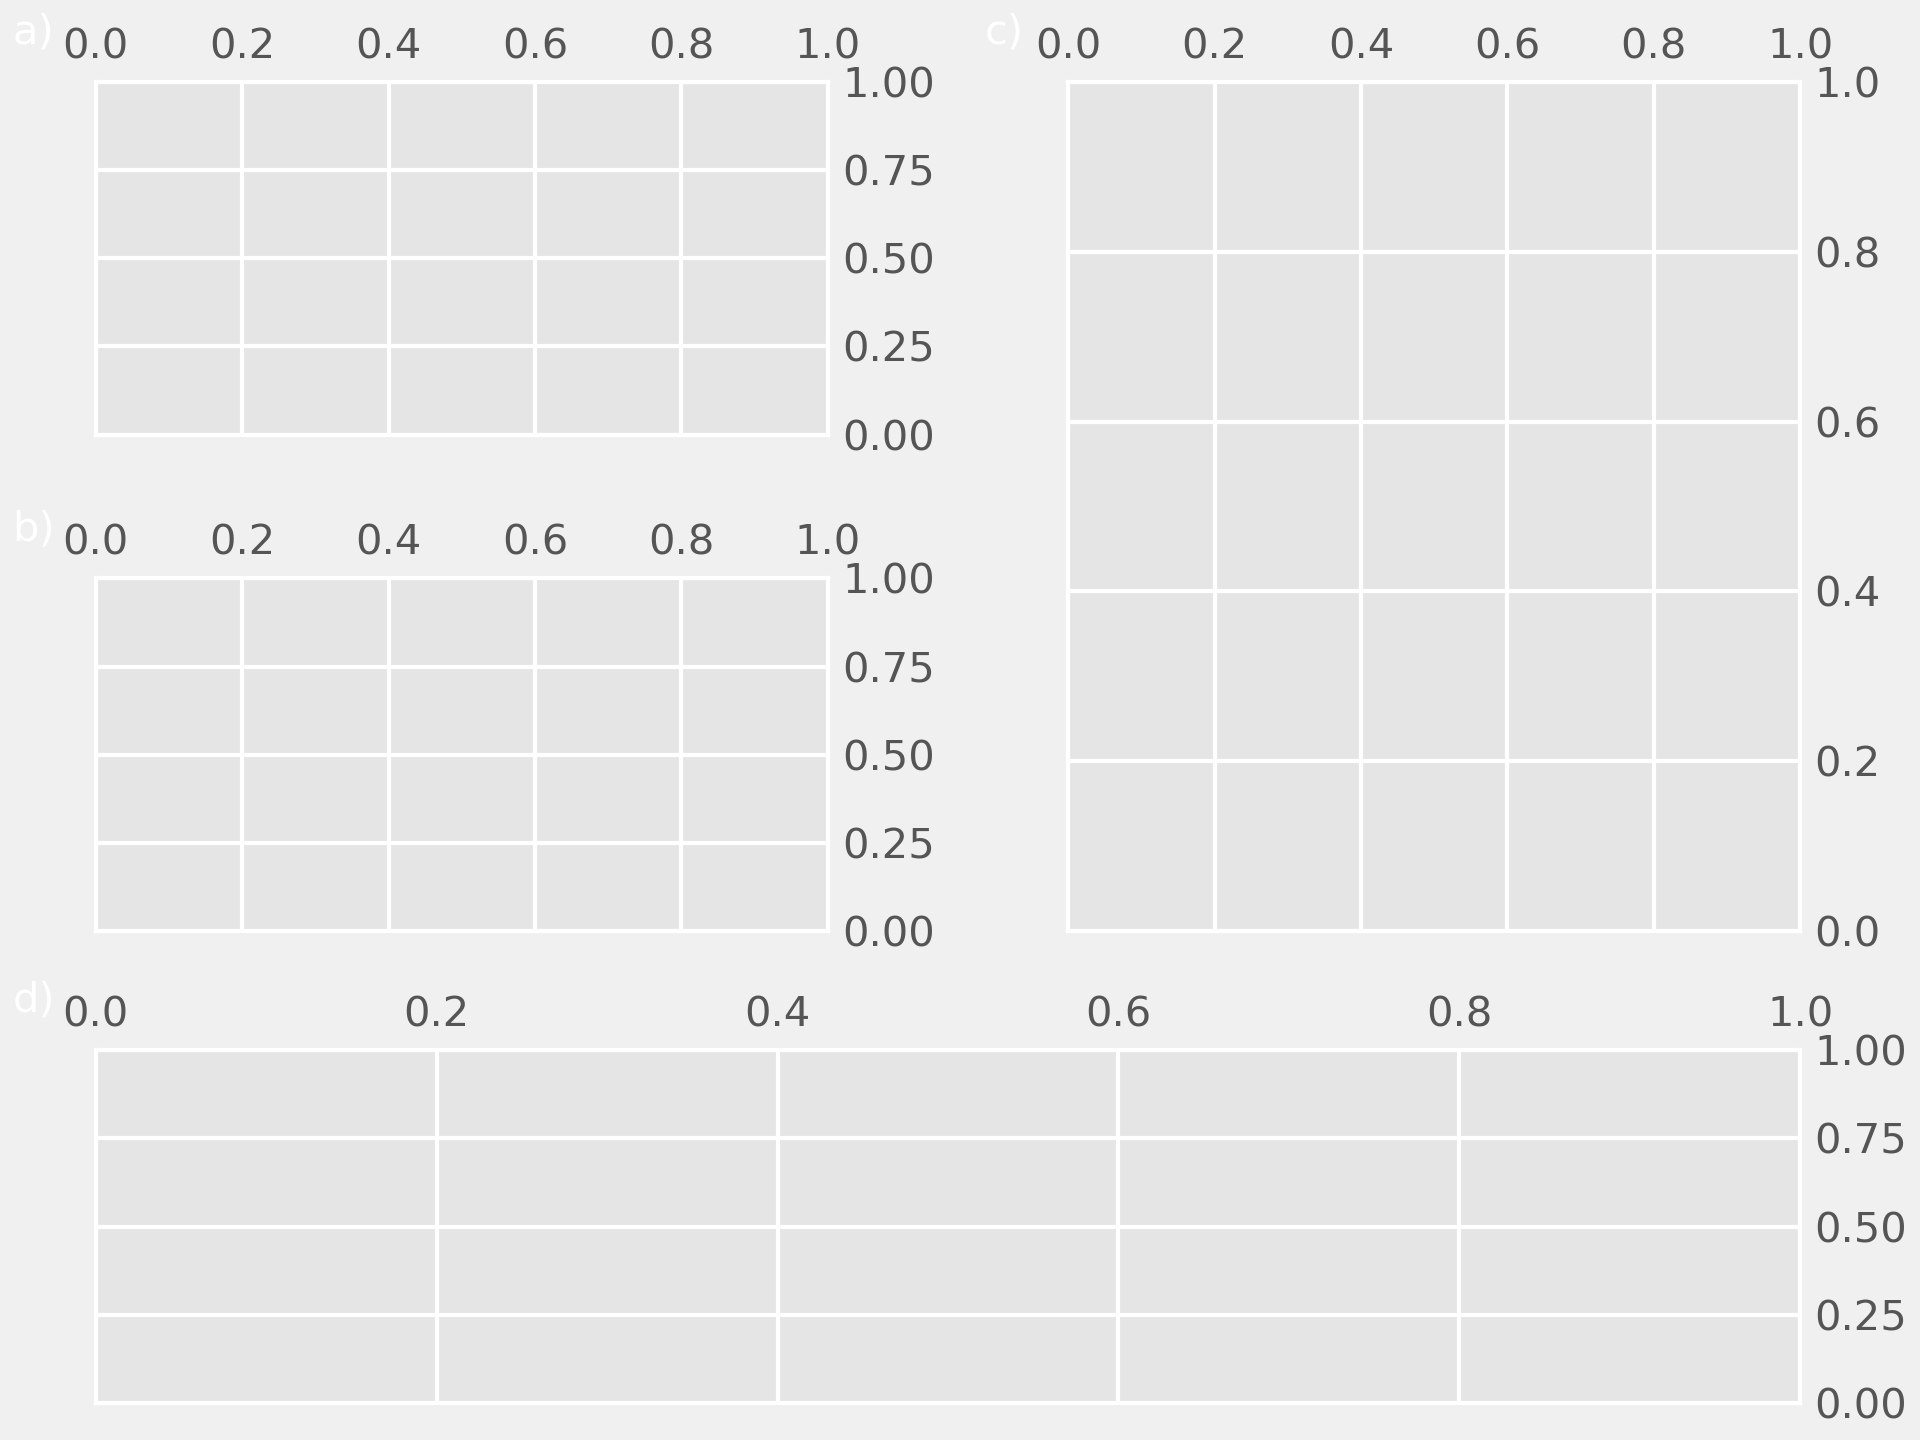
... # We may prefer the labels outside the axes, but still aligned
... # with each other, in which case we use a slightly different transform:
...
... fig, axs = plt.subplot_mosaic([['a)', 'c)'], ['b)', 'c)'], ['d)', 'd)']],
... constrained_layout=True)
...
... for label, ax in axs.items():
... # label physical distance to the left and up:
... trans = mtransforms.ScaledTranslation(-20/72, 7/72, fig.dpi_scale_trans)
... ax.text(0.0, 1.0, label, transform=ax.transAxes + trans,
... fontsize='medium', va='bottom', fontfamily='serif')
...
... plt.show()
...
... ##############################################################################
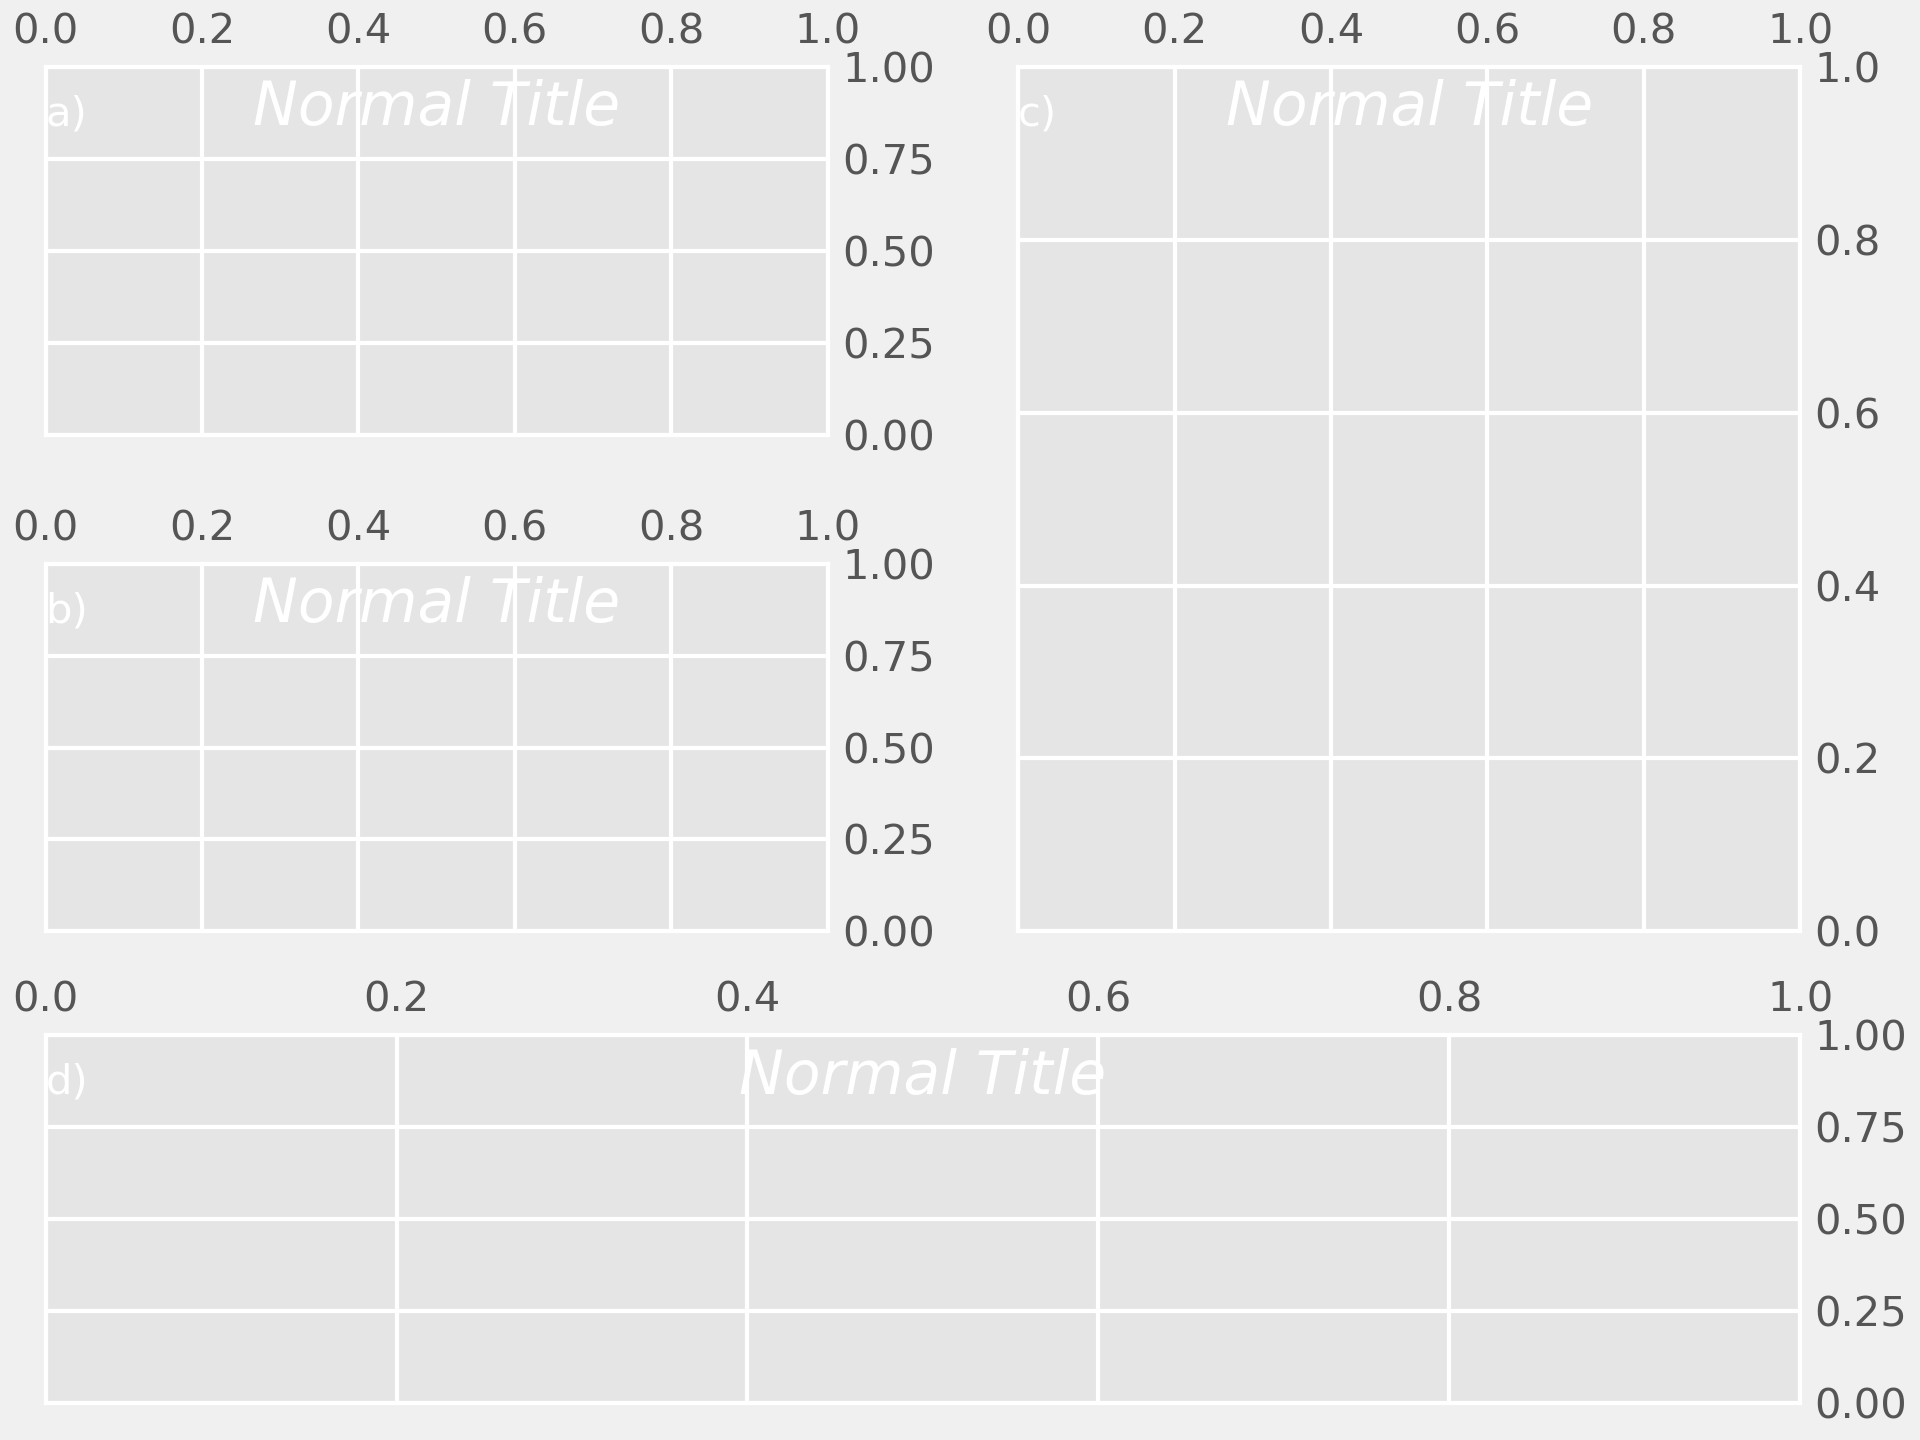
... # If we want it aligned with the title, either incorporate in the title or
... # use the *loc* keyword argument:
...
... fig, axs = plt.subplot_mosaic([['a)', 'c)'], ['b)', 'c)'], ['d)', 'd)']],
... constrained_layout=True)
...
... for label, ax in axs.items():
... ax.set_title('Normal Title', fontstyle='italic')
... ax.set_title(label, fontfamily='serif', loc='left', fontsize='medium')
...
... plt.show()
...
... #############################################################################
... #
... # .. admonition:: References
... #
... # The use of the following functions, methods, classes and modules is shown
... # in this example:
... #
... # - `matplotlib.figure.Figure.subplot_mosaic` /
... # `matplotlib.pyplot.subplot_mosaic`
... # - `matplotlib.axes.Axes.set_title`
... # - `matplotlib.axes.Axes.text`
... # - `matplotlib.transforms.ScaledTranslation`
...