>>> """
======================
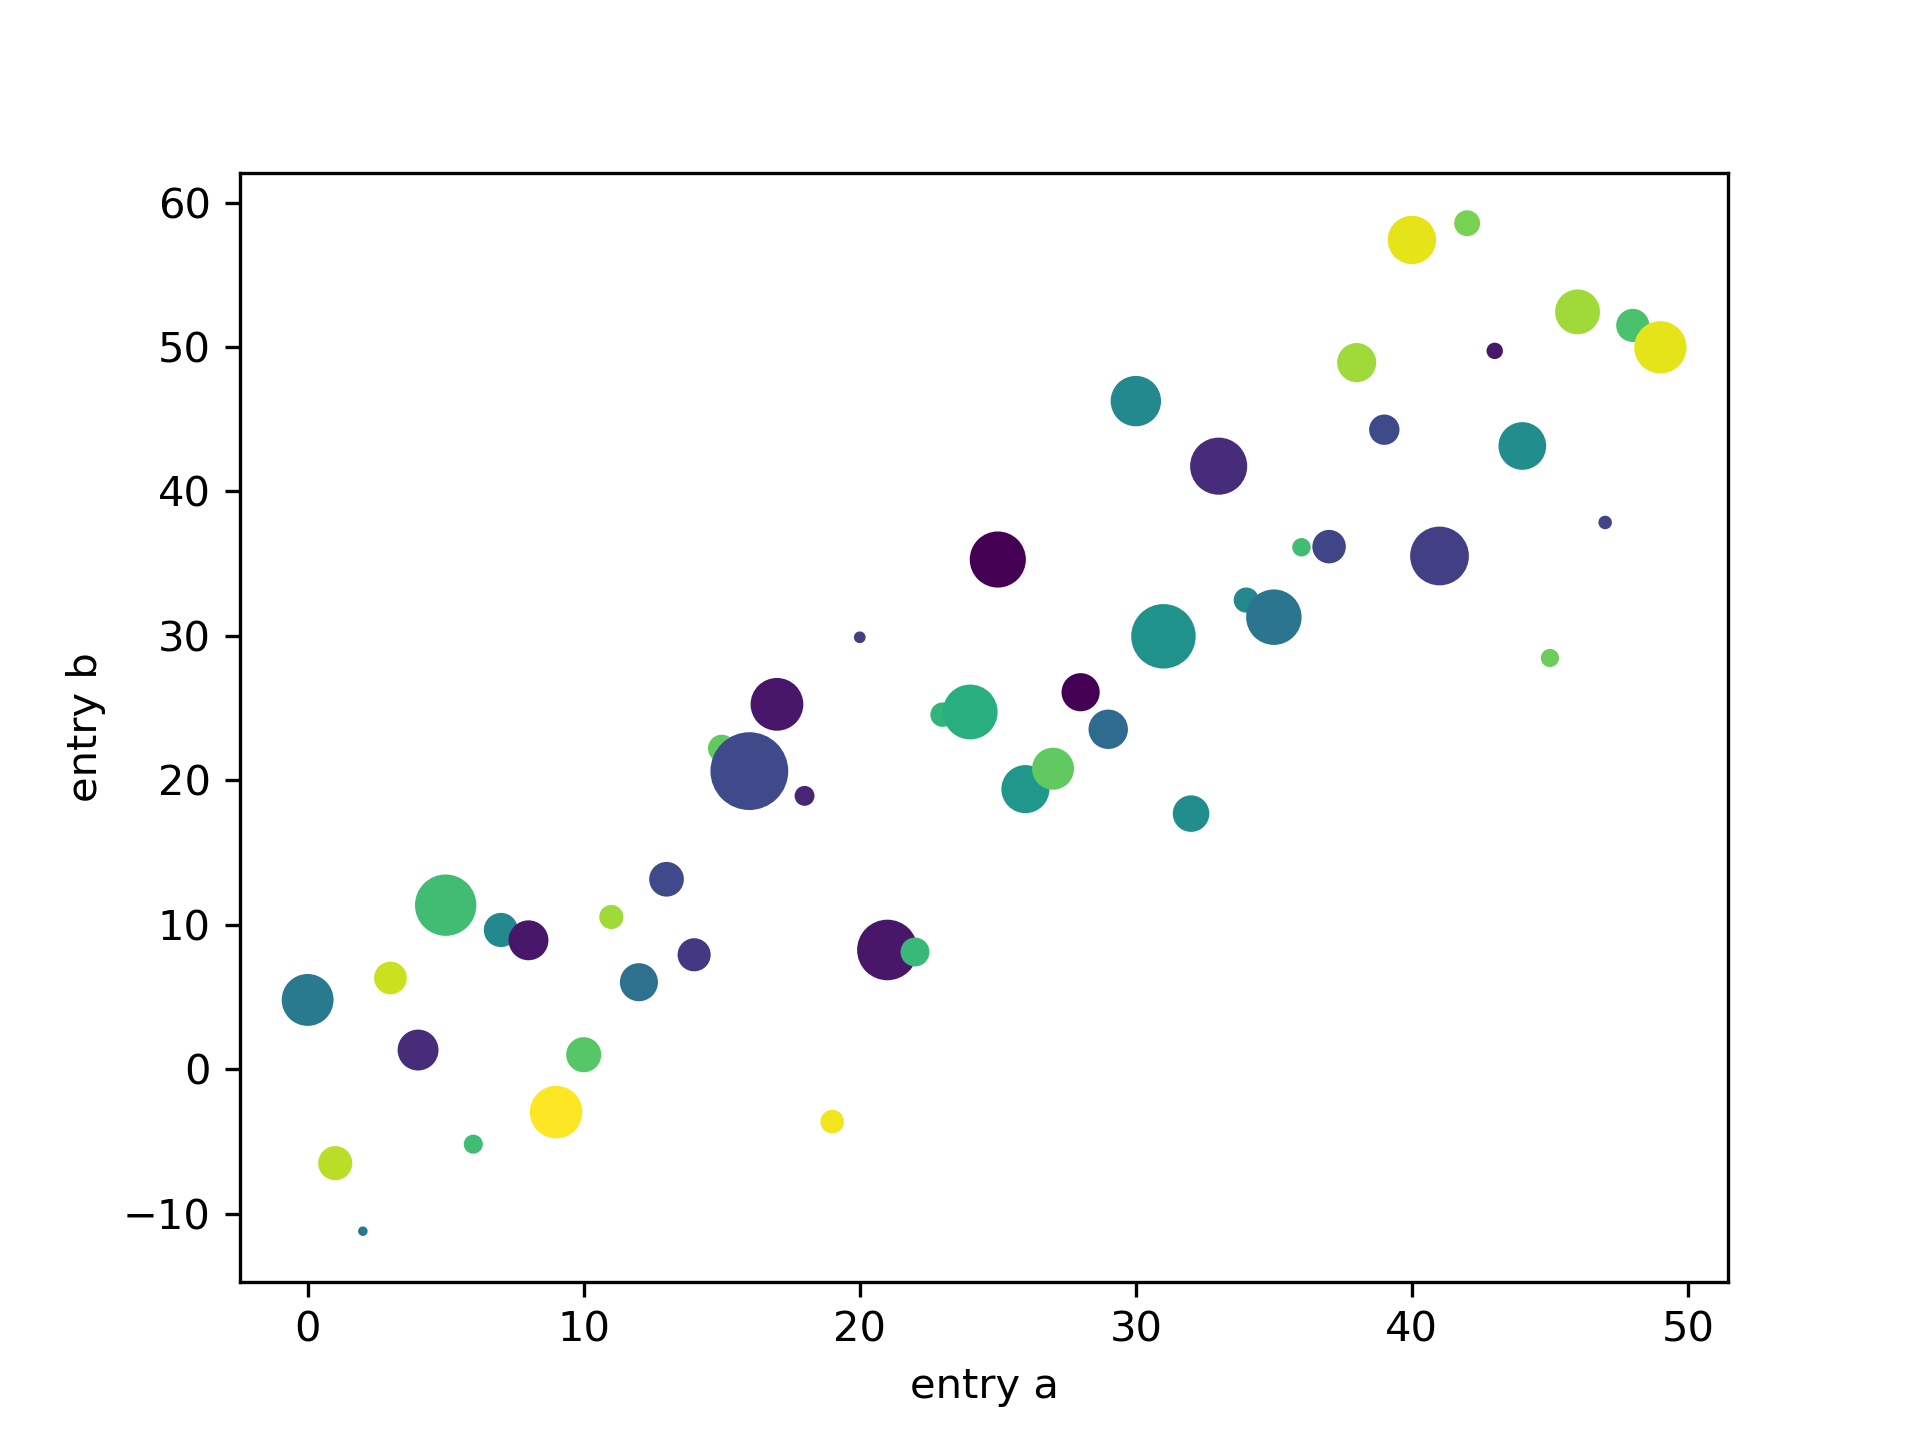
Plotting with keywords
======================
There are some instances where you have data in a format that lets you
access particular variables with strings: for example, with
`numpy.recarray` or `pandas.DataFrame`.
Matplotlib allows you provide such an object with the ``data`` keyword
argument. If provided, then you may generate plots with the strings
corresponding to these variables.
"""
...
... import numpy as np
... import matplotlib.pyplot as plt
... np.random.seed(19680801)
...
... data = {'a': np.arange(50),
... 'c': np.random.randint(0, 50, 50),
... 'd': np.random.randn(50)}
... data['b'] = data['a'] + 10 * np.random.randn(50)
... data['d'] = np.abs(data['d']) * 100
...
... fig, ax = plt.subplots()
... ax.scatter('a', 'b', c='c', s='d', data=data)
... ax.set(xlabel='entry a', ylabel='entry b')
... plt.show()
...