>>> """
=========================
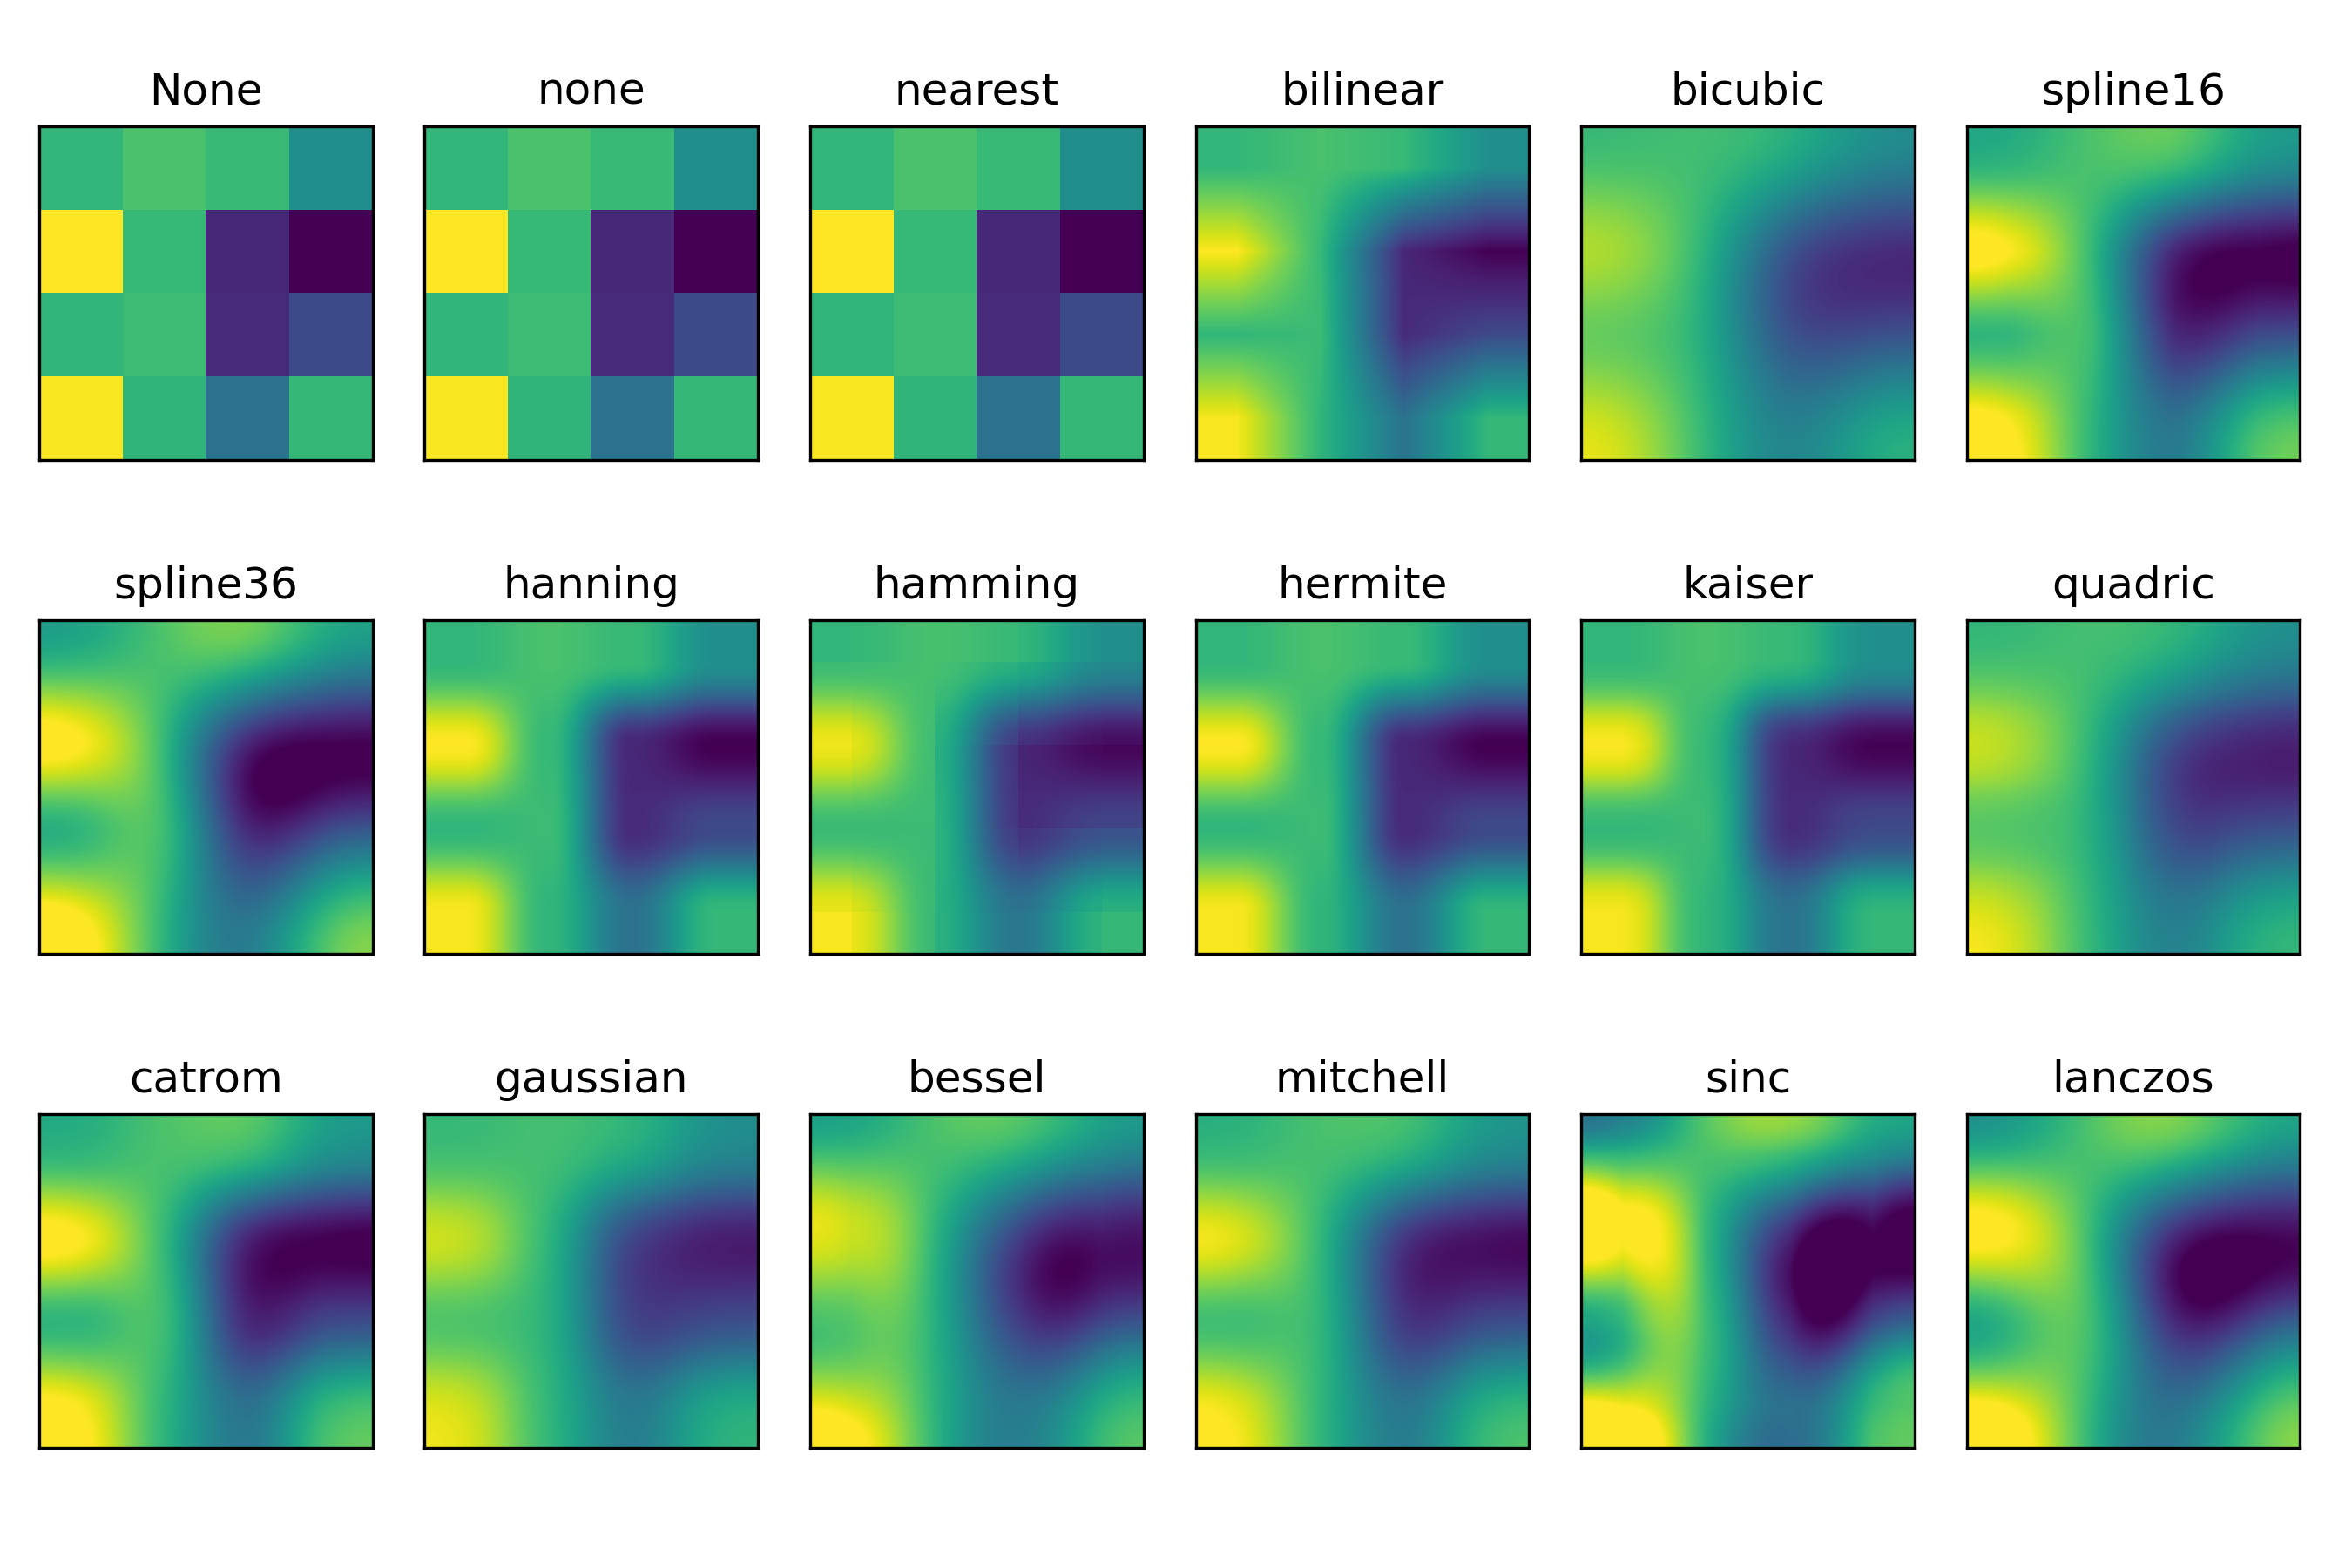
Interpolations for imshow
=========================
This example displays the difference between interpolation methods for
`~.axes.Axes.imshow`.
If *interpolation* is None, it defaults to the :rc:`image.interpolation`.
If the interpolation is ``'none'``, then no interpolation is performed for the
Agg, ps and pdf backends. Other backends will default to ``'antialiased'``.
For the Agg, ps and pdf backends, ``interpolation = 'none'`` works well when a
big image is scaled down, while ``interpolation = 'nearest'`` works well when
a small image is scaled up.
See :doc:`/gallery/images_contours_and_fields/image_antialiasing` for a
discussion on the default ``interpolation="antialiased"`` option.
"""
...
... import matplotlib.pyplot as plt
... import numpy as np
...
... methods = [None, 'none', 'nearest', 'bilinear', 'bicubic', 'spline16',
... 'spline36', 'hanning', 'hamming', 'hermite', 'kaiser', 'quadric',
... 'catrom', 'gaussian', 'bessel', 'mitchell', 'sinc', 'lanczos']
...
... # Fixing random state for reproducibility
... np.random.seed(19680801)
...
... grid = np.random.rand(4, 4)
...
... fig, axs = plt.subplots(nrows=3, ncols=6, figsize=(9, 6),
... subplot_kw={'xticks': [], 'yticks': []})
...
... for ax, interp_method in zip(axs.flat, methods):
... ax.imshow(grid, interpolation=interp_method, cmap='viridis')
... ax.set_title(str(interp_method))
...
... plt.tight_layout()
... plt.show()
...
... #############################################################################
... #
... # .. admonition:: References
... #
... # The use of the following functions, methods, classes and modules is shown
... # in this example:
... #
... # - `matplotlib.axes.Axes.imshow` / `matplotlib.pyplot.imshow`
...