>>> """
===================
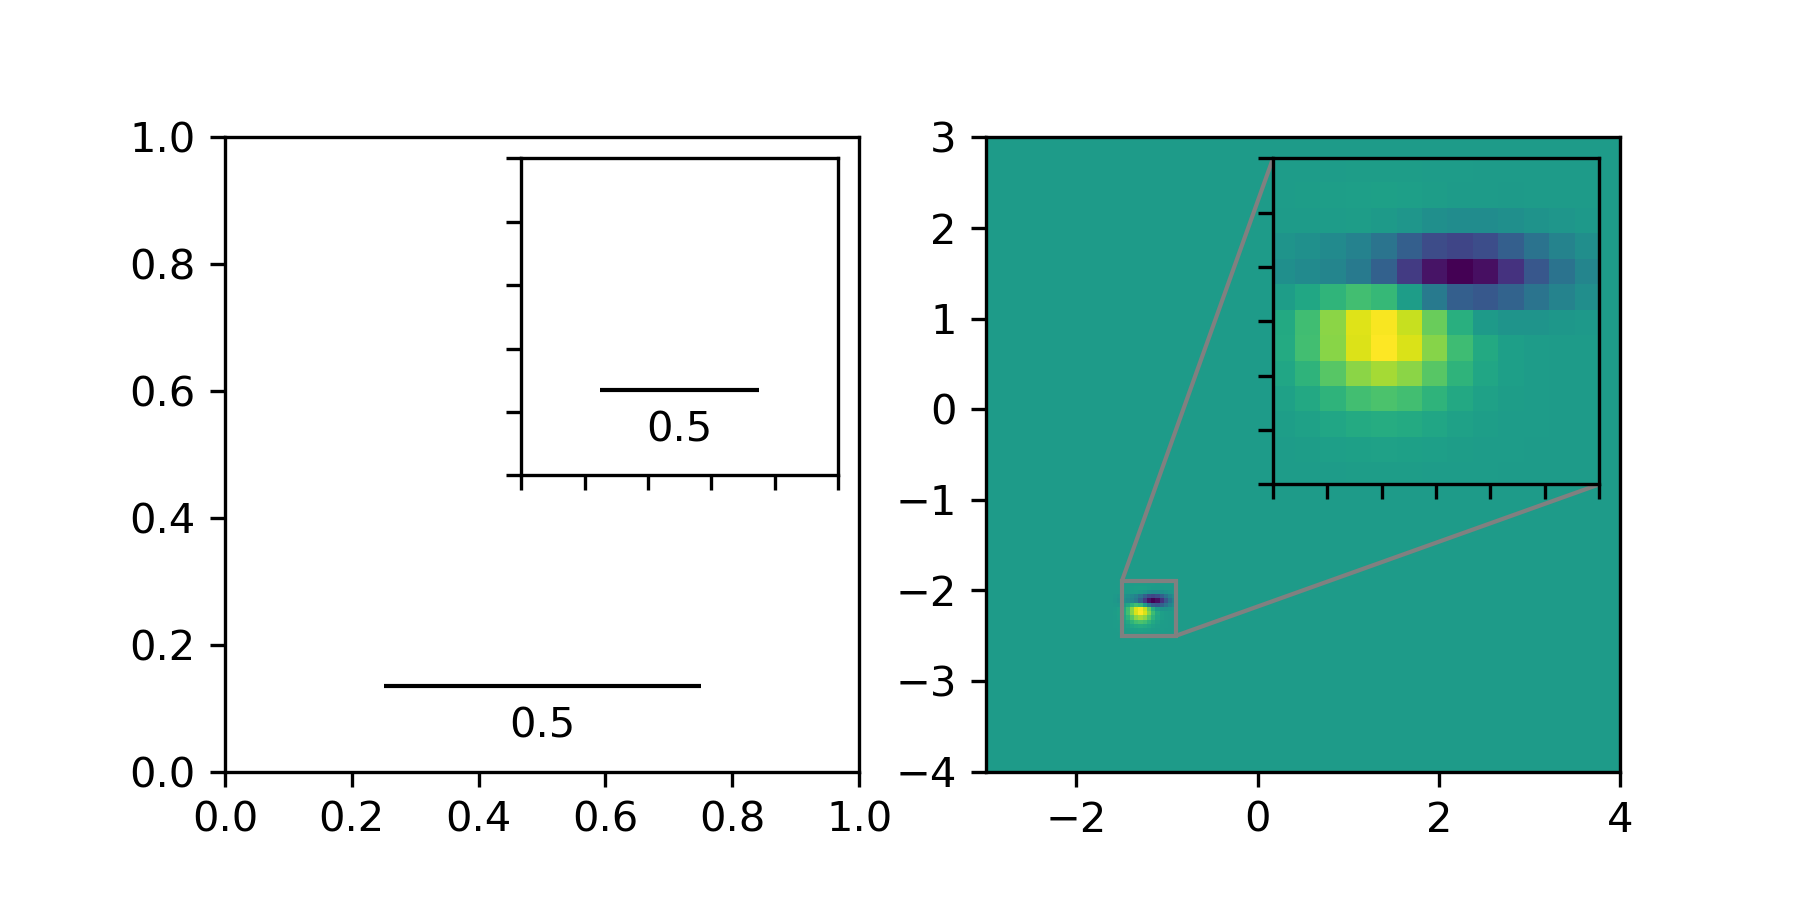
Inset Locator Demo2
===================
This Demo shows how to create a zoomed inset via `.zoomed_inset_axes`.
In the first subplot an `.AnchoredSizeBar` shows the zoom effect.
In the second subplot a connection to the region of interest is
created via `.mark_inset`.
"""
...
... from matplotlib import cbook
... import matplotlib.pyplot as plt
... from mpl_toolkits.axes_grid1.inset_locator import zoomed_inset_axes, mark_inset
... from mpl_toolkits.axes_grid1.anchored_artists import AnchoredSizeBar
...
... import numpy as np
...
...
... def get_demo_image():
... z = cbook.get_sample_data("axes_grid/bivariate_normal.npy", np_load=True)
... # z is a numpy array of 15x15
... return z, (-3, 4, -4, 3)
...
... fig, (ax, ax2) = plt.subplots(ncols=2, figsize=[6, 3])
...
...
... # First subplot, showing an inset with a size bar.
... ax.set_aspect(1)
...
... axins = zoomed_inset_axes(ax, zoom=0.5, loc='upper right')
... # fix the number of ticks on the inset axes
... axins.yaxis.get_major_locator().set_params(nbins=7)
... axins.xaxis.get_major_locator().set_params(nbins=7)
... axins.tick_params(labelleft=False, labelbottom=False)
...
...
... def add_sizebar(ax, size):
... asb = AnchoredSizeBar(ax.transData,
... size,
... str(size),
... loc=8,
... pad=0.1, borderpad=0.5, sep=5,
... frameon=False)
... ax.add_artist(asb)
...
... add_sizebar(ax, 0.5)
... add_sizebar(axins, 0.5)
...
...
... # Second subplot, showing an image with an inset zoom
... # and a marked inset
... Z, extent = get_demo_image()
... Z2 = np.zeros((150, 150))
... ny, nx = Z.shape
... Z2[30:30+ny, 30:30+nx] = Z
...
... ax2.imshow(Z2, extent=extent, origin="lower")
...
... axins2 = zoomed_inset_axes(ax2, zoom=6, loc=1)
... axins2.imshow(Z2, extent=extent, origin="lower")
...
... # sub region of the original image
... x1, x2, y1, y2 = -1.5, -0.9, -2.5, -1.9
... axins2.set_xlim(x1, x2)
... axins2.set_ylim(y1, y2)
... # fix the number of ticks on the inset axes
... axins2.yaxis.get_major_locator().set_params(nbins=7)
... axins2.xaxis.get_major_locator().set_params(nbins=7)
... axins2.tick_params(labelleft=False, labelbottom=False)
...
... # draw a bbox of the region of the inset axes in the parent axes and
... # connecting lines between the bbox and the inset axes area
... mark_inset(ax2, axins2, loc1=2, loc2=4, fc="none", ec="0.5")
...
... plt.show()
...