>>> """
==================
Inset Locator Demo
==================
"""
...
... ###############################################################################
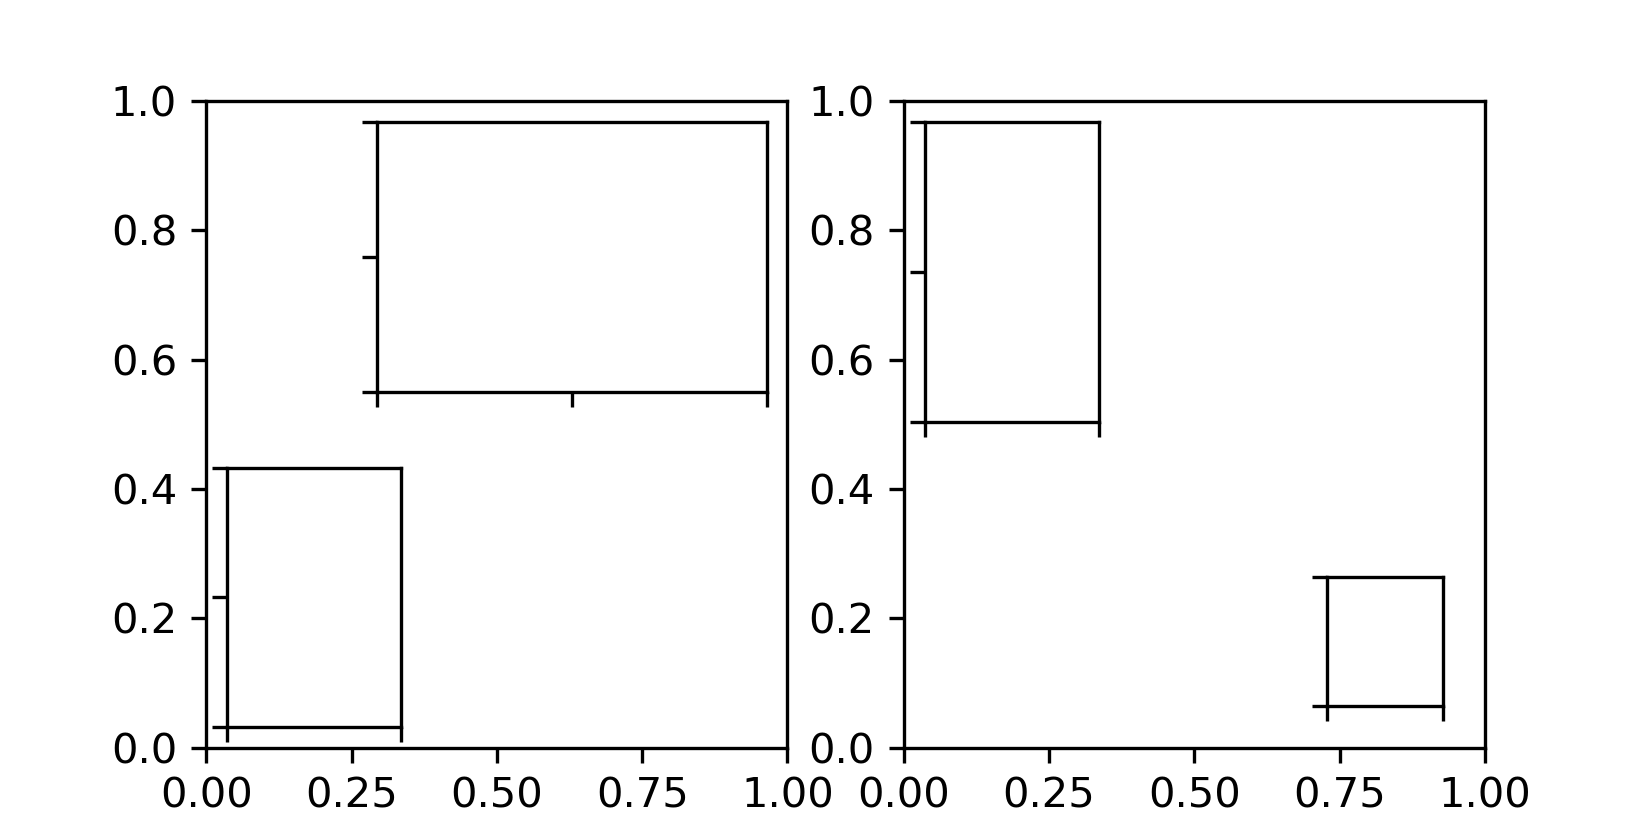
... # The `.inset_locator`'s `~.inset_locator.inset_axes` allows
... # easily placing insets in the corners of the axes by specifying a width and
... # height and optionally a location (loc) that accepts locations as codes,
... # similar to `~matplotlib.axes.Axes.legend`.
... # By default, the inset is offset by some points from the axes,
... # controlled via the *borderpad* parameter.
...
... import matplotlib.pyplot as plt
... from mpl_toolkits.axes_grid1.inset_locator import inset_axes
...
...
... fig, (ax, ax2) = plt.subplots(1, 2, figsize=[5.5, 2.8])
...
... # Create inset of width 1.3 inches and height 0.9 inches
... # at the default upper right location
... axins = inset_axes(ax, width=1.3, height=0.9)
...
... # Create inset of width 30% and height 40% of the parent axes' bounding box
... # at the lower left corner (loc=3)
... axins2 = inset_axes(ax, width="30%", height="40%", loc=3)
...
... # Create inset of mixed specifications in the second subplot;
... # width is 30% of parent axes' bounding box and
... # height is 1 inch at the upper left corner (loc=2)
... axins3 = inset_axes(ax2, width="30%", height=1., loc=2)
...
... # Create an inset in the lower right corner (loc=4) with borderpad=1, i.e.
... # 10 points padding (as 10pt is the default fontsize) to the parent axes
... axins4 = inset_axes(ax2, width="20%", height="20%", loc=4, borderpad=1)
...
... # Turn ticklabels of insets off
... for axi in [axins, axins2, axins3, axins4]:
... axi.tick_params(labelleft=False, labelbottom=False)
...
... plt.show()
...
...
... ###############################################################################
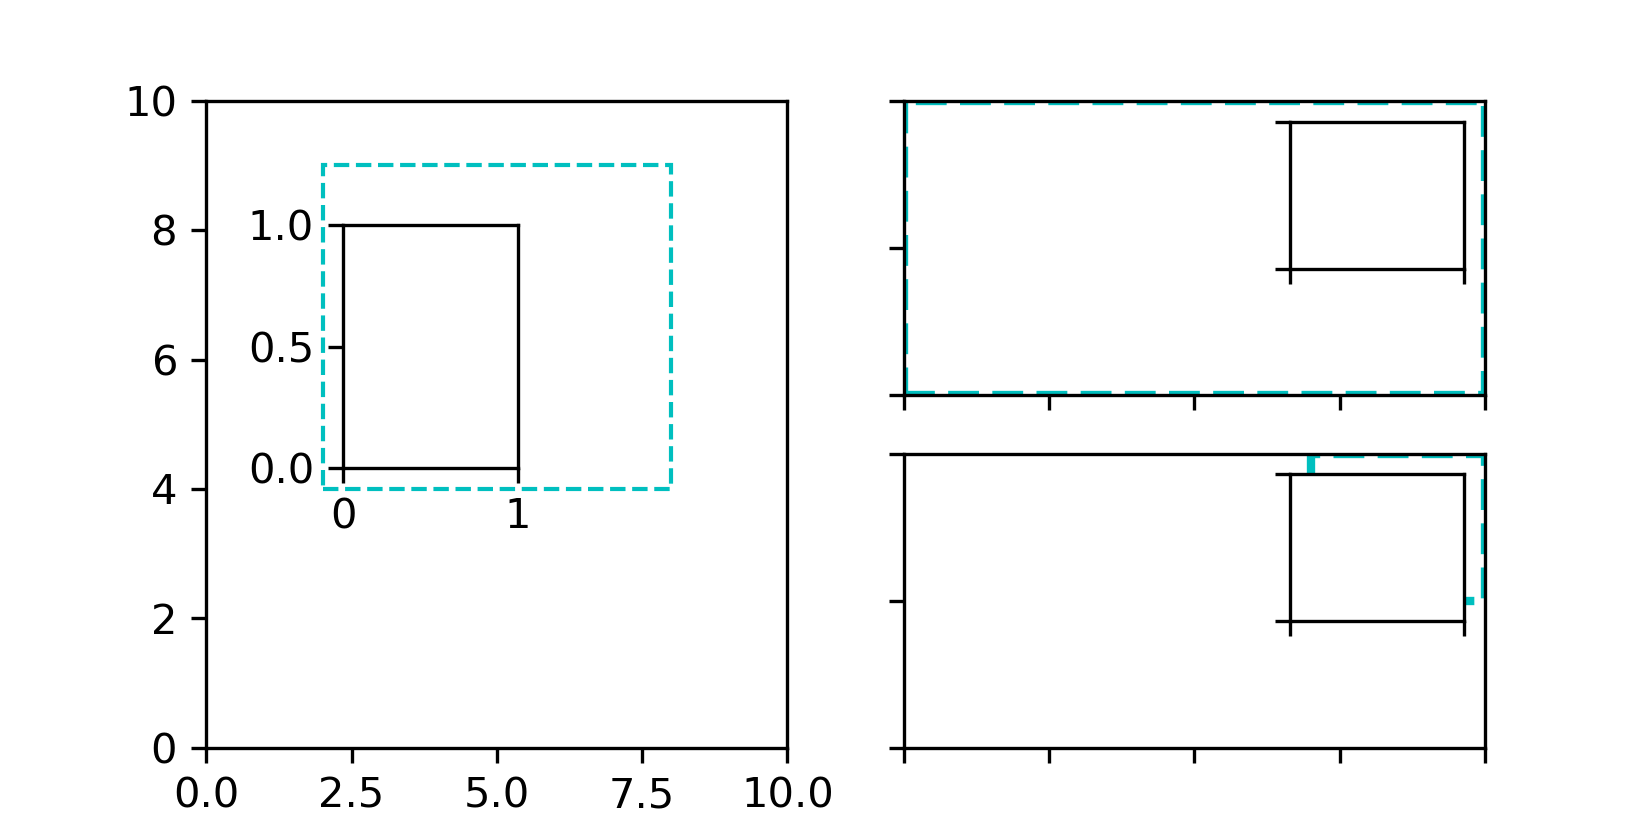
... # The parameters *bbox_to_anchor* and *bbox_transform* can be used for a more
... # fine grained control over the inset position and size or even to position
... # the inset at completely arbitrary positions.
... # The *bbox_to_anchor* sets the bounding box in coordinates according to the
... # *bbox_transform*.
... #
...
... fig = plt.figure(figsize=[5.5, 2.8])
... ax = fig.add_subplot(121)
...
... # We use the axes transform as bbox_transform. Therefore the bounding box
... # needs to be specified in axes coordinates ((0, 0) is the lower left corner
... # of the axes, (1, 1) is the upper right corner).
... # The bounding box (.2, .4, .6, .5) starts at (.2, .4) and ranges to (.8, .9)
... # in those coordinates.
... # Inside of this bounding box an inset of half the bounding box' width and
... # three quarters of the bounding box' height is created. The lower left corner
... # of the inset is aligned to the lower left corner of the bounding box (loc=3).
... # The inset is then offset by the default 0.5 in units of the font size.
...
... axins = inset_axes(ax, width="50%", height="75%",
... bbox_to_anchor=(.2, .4, .6, .5),
... bbox_transform=ax.transAxes, loc=3)
...
... # For visualization purposes we mark the bounding box by a rectangle
... ax.add_patch(plt.Rectangle((.2, .4), .6, .5, ls="--", ec="c", fc="none",
... transform=ax.transAxes))
...
... # We set the axis limits to something other than the default, in order to not
... # distract from the fact that axes coordinates are used here.
... ax.set(xlim=(0, 10), ylim=(0, 10))
...
...
... # Note how the two following insets are created at the same positions, one by
... # use of the default parent axes' bbox and the other via a bbox in axes
... # coordinates and the respective transform.
... ax2 = fig.add_subplot(222)
... axins2 = inset_axes(ax2, width="30%", height="50%")
...
... ax3 = fig.add_subplot(224)
... axins3 = inset_axes(ax3, width="100%", height="100%",
... bbox_to_anchor=(.7, .5, .3, .5),
... bbox_transform=ax3.transAxes)
...
... # For visualization purposes we mark the bounding box by a rectangle
... ax2.add_patch(plt.Rectangle((0, 0), 1, 1, ls="--", lw=2, ec="c", fc="none"))
... ax3.add_patch(plt.Rectangle((.7, .5), .3, .5, ls="--", lw=2,
... ec="c", fc="none"))
...
... # Turn ticklabels off
... for axi in [axins2, axins3, ax2, ax3]:
... axi.tick_params(labelleft=False, labelbottom=False)
...
... plt.show()
...
...
... ###############################################################################
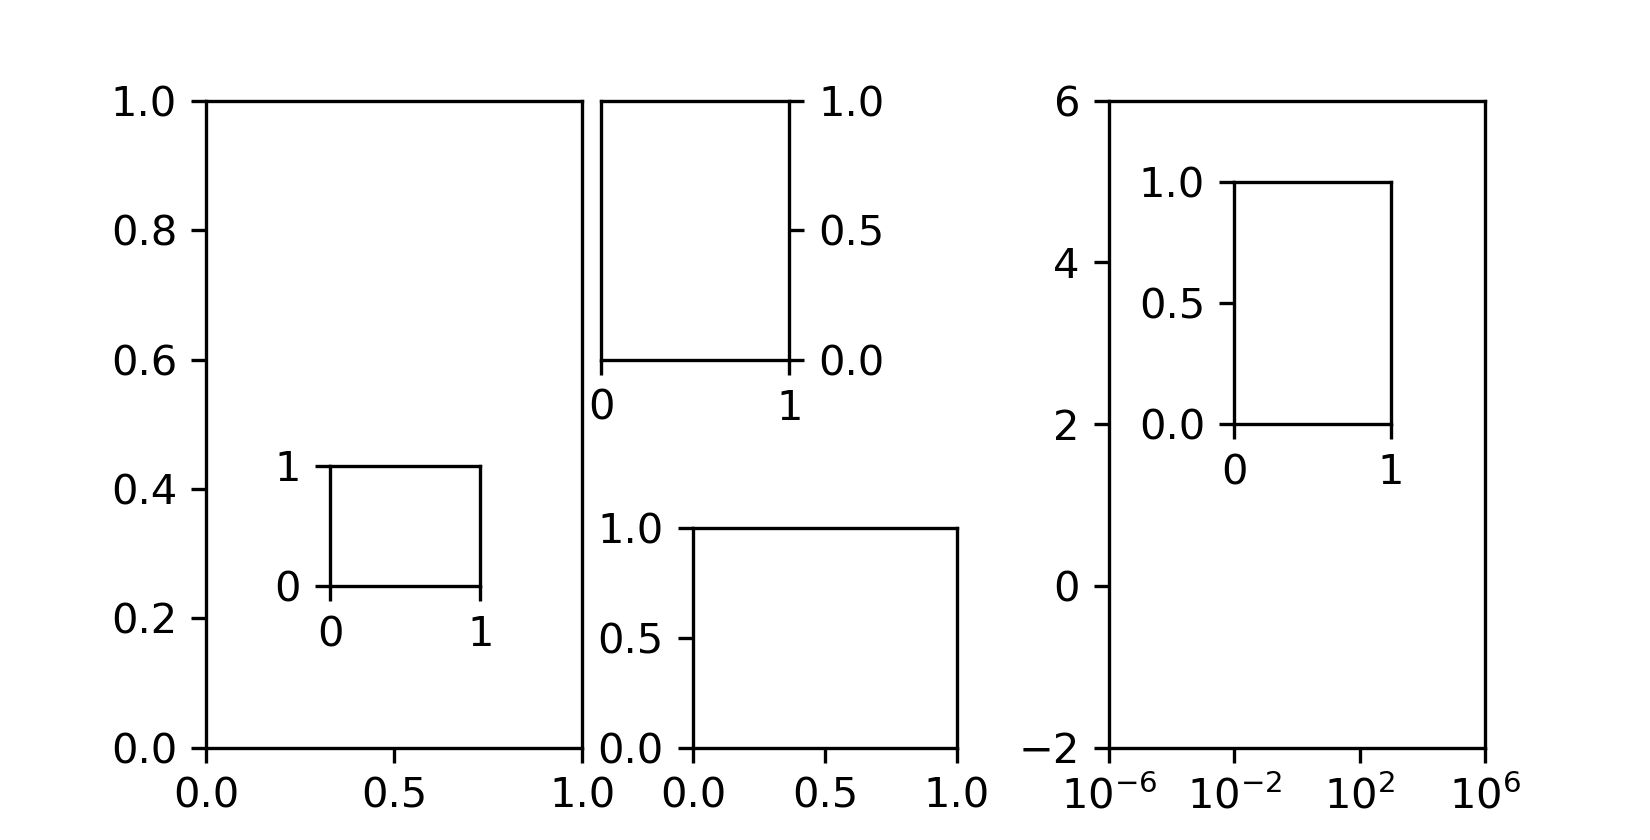
... # In the above the axes transform together with 4-tuple bounding boxes has been
... # used as it mostly is useful to specify an inset relative to the axes it is
... # an inset to. However other use cases are equally possible. The following
... # example examines some of those.
... #
...
... fig = plt.figure(figsize=[5.5, 2.8])
... ax = fig.add_subplot(131)
...
... # Create an inset outside the axes
... axins = inset_axes(ax, width="100%", height="100%",
... bbox_to_anchor=(1.05, .6, .5, .4),
... bbox_transform=ax.transAxes, loc=2, borderpad=0)
... axins.tick_params(left=False, right=True, labelleft=False, labelright=True)
...
... # Create an inset with a 2-tuple bounding box. Note that this creates a
... # bbox without extent. This hence only makes sense when specifying
... # width and height in absolute units (inches).
... axins2 = inset_axes(ax, width=0.5, height=0.4,
... bbox_to_anchor=(0.33, 0.25),
... bbox_transform=ax.transAxes, loc=3, borderpad=0)
...
...
... ax2 = fig.add_subplot(133)
... ax2.set_xscale("log")
... ax2.set(xlim=(1e-6, 1e6), ylim=(-2, 6))
...
... # Create inset in data coordinates using ax.transData as transform
... axins3 = inset_axes(ax2, width="100%", height="100%",
... bbox_to_anchor=(1e-2, 2, 1e3, 3),
... bbox_transform=ax2.transData, loc=2, borderpad=0)
...
... # Create an inset horizontally centered in figure coordinates and vertically
... # bound to line up with the axes.
... from matplotlib.transforms import blended_transform_factory # noqa
... transform = blended_transform_factory(fig.transFigure, ax2.transAxes)
... axins4 = inset_axes(ax2, width="16%", height="34%",
... bbox_to_anchor=(0, 0, 1, 1),
... bbox_transform=transform, loc=8, borderpad=0)
...
... plt.show()
...