>>> """
==================================
Modifying the coordinate formatter
==================================
Modify the coordinate formatter to report the image "z"
value of the nearest pixel given x and y.
This functionality is built in by default, but it
is still useful to show how to customize the
`~.axes.Axes.format_coord` function.
"""
... import numpy as np
... import matplotlib.pyplot as plt
...
... # Fixing random state for reproducibility
... np.random.seed(19680801)
...
...
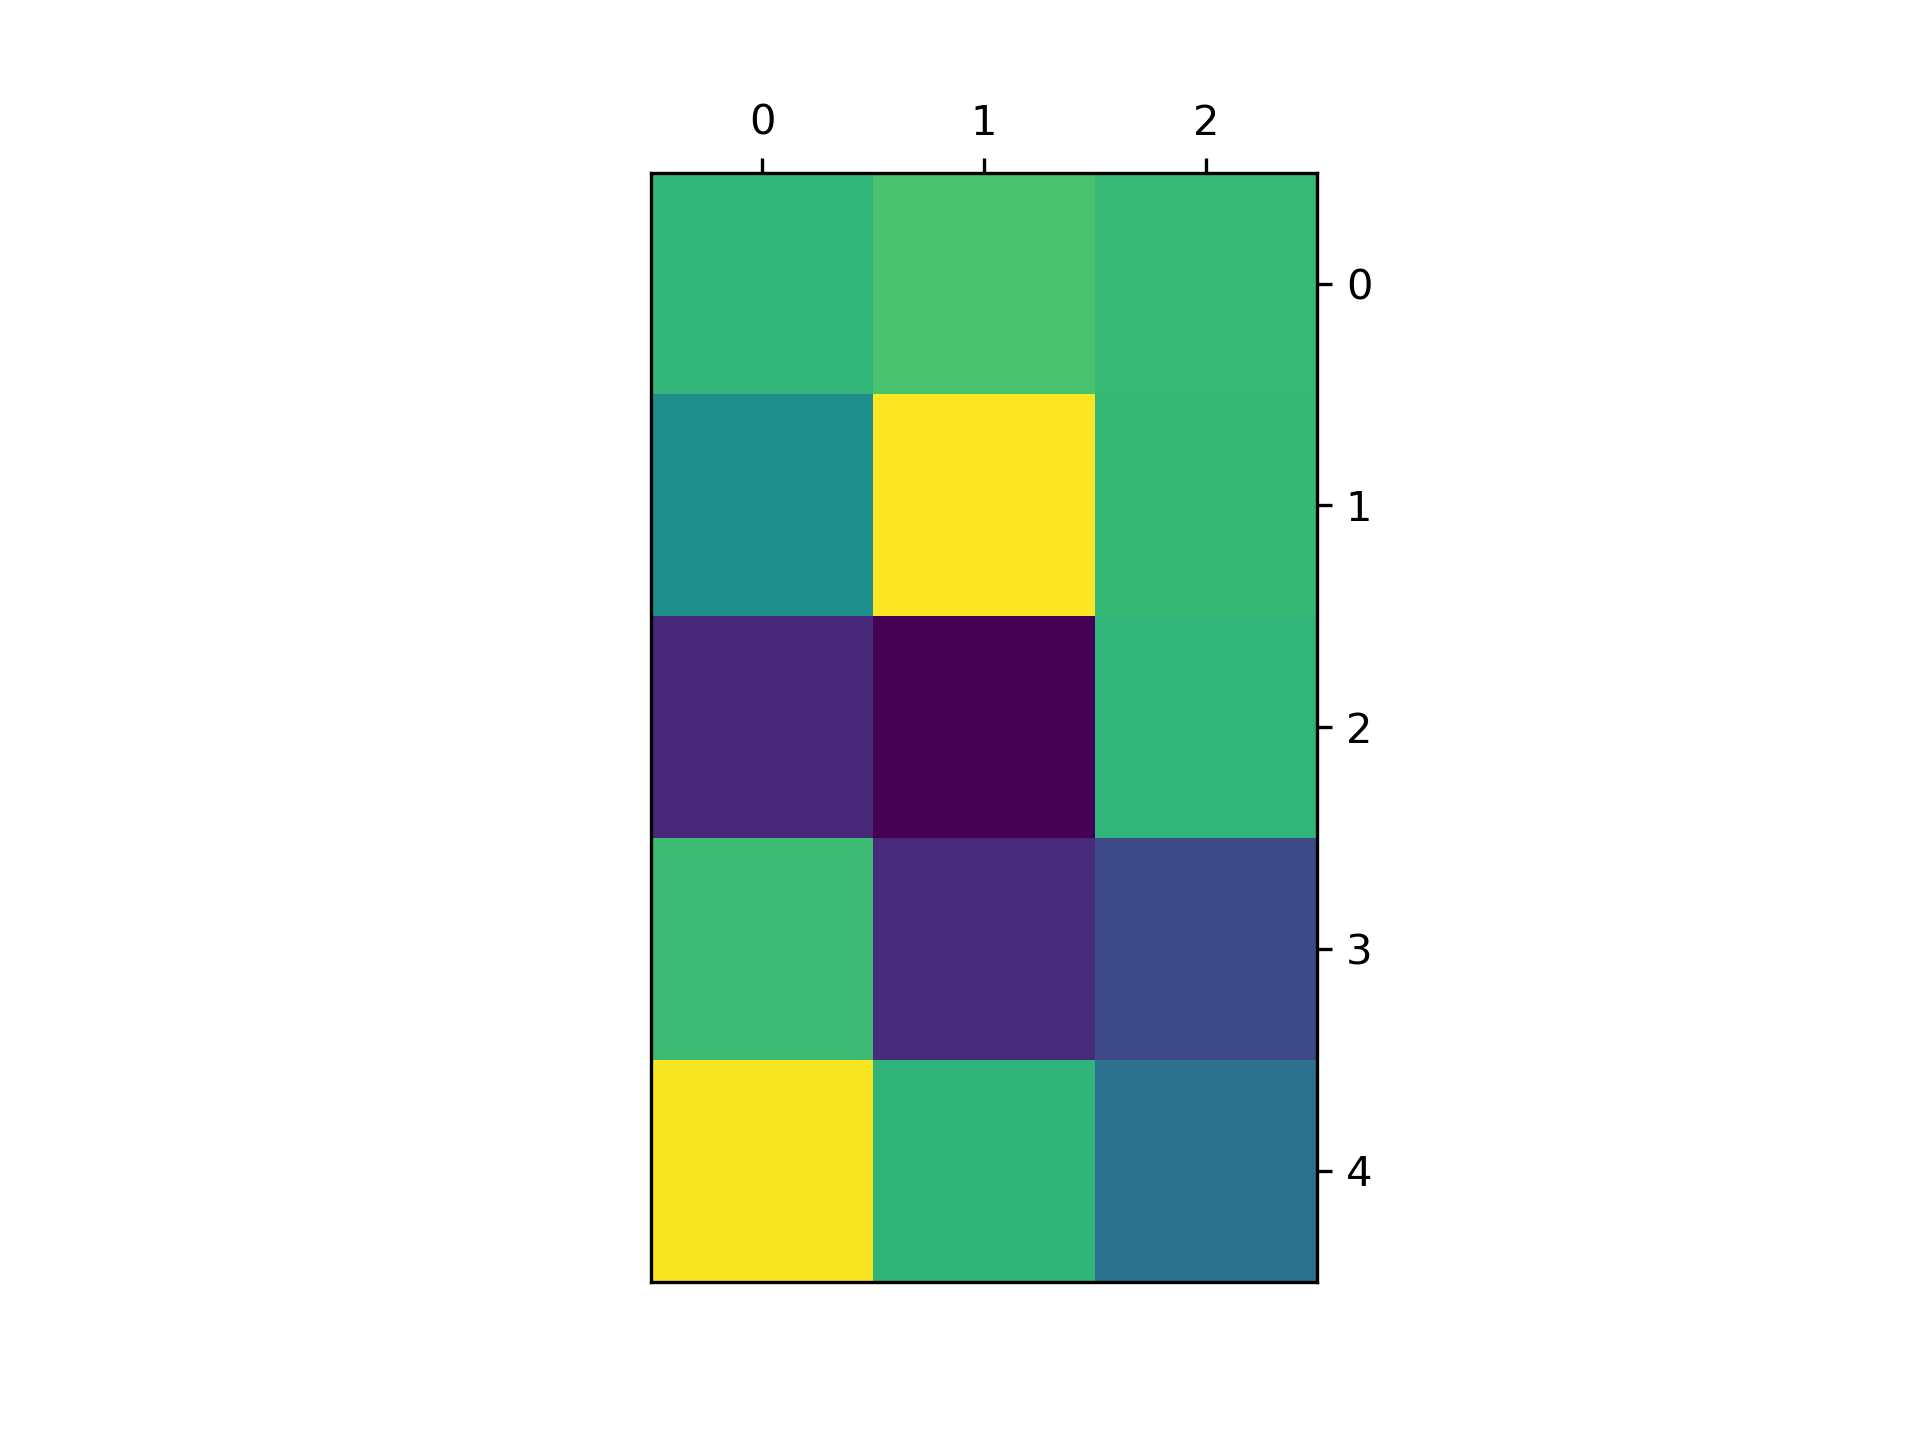
... X = 10*np.random.rand(5, 3)
...
... fig, ax = plt.subplots()
... ax.imshow(X)
...
... numrows, numcols = X.shape
...
...
... def format_coord(x, y):
... col = int(x + 0.5)
... row = int(y + 0.5)
... if 0 <= col < numcols and 0 <= row < numrows:
... z = X[row, col]
... return 'x=%1.4f, y=%1.4f, z=%1.4f' % (x, y, z)
... else:
... return 'x=%1.4f, y=%1.4f' % (x, y)
...
... ax.format_coord = format_coord
... plt.show()
...
... #############################################################################
... #
... # .. admonition:: References
... #
... # The use of the following functions, methods, classes and modules is shown
... # in this example:
... #
... # - `matplotlib.axes.Axes.format_coord`
... # - `matplotlib.axes.Axes.imshow`
...