>>> """
================================================================
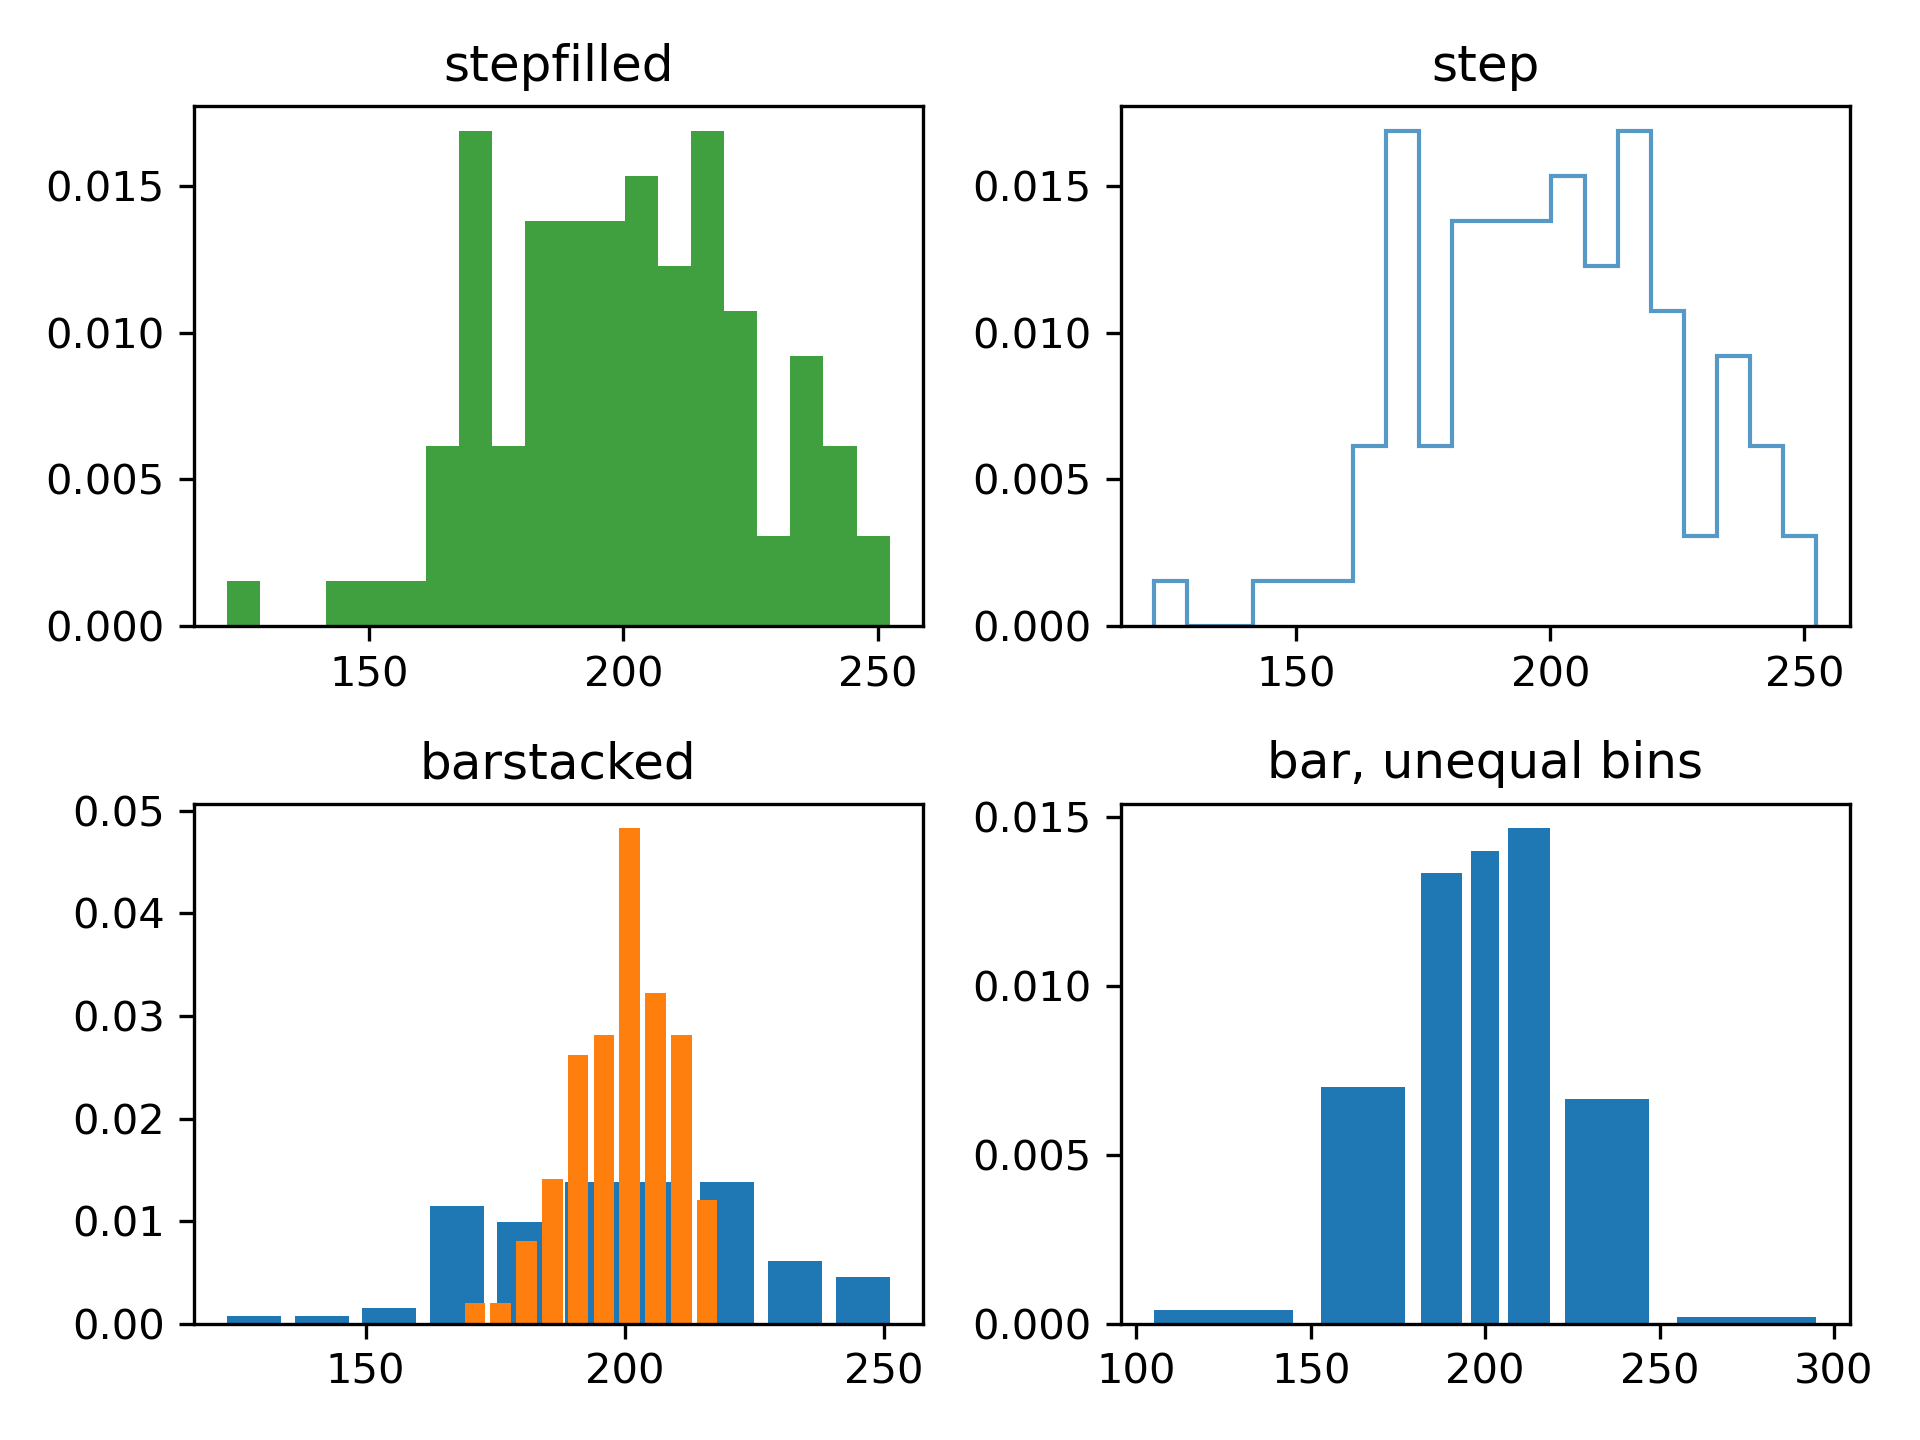
Demo of the histogram function's different ``histtype`` settings
================================================================
* Histogram with step curve that has a color fill.
* Histogram with step curve with no fill.
* Histogram with custom and unequal bin widths.
* Two histograms with stacked bars.
Selecting different bin counts and sizes can significantly affect the
shape of a histogram. The Astropy docs have a great section on how to
select these parameters:
http://docs.astropy.org/en/stable/visualization/histogram.html
"""
...
... import numpy as np
... import matplotlib.pyplot as plt
...
... np.random.seed(19680801)
...
... mu_x = 200
... sigma_x = 25
... x = np.random.normal(mu_x, sigma_x, size=100)
...
... mu_w = 200
... sigma_w = 10
... w = np.random.normal(mu_w, sigma_w, size=100)
...
... fig, axs = plt.subplots(nrows=2, ncols=2)
...
... axs[0, 0].hist(x, 20, density=True, histtype='stepfilled', facecolor='g',
... alpha=0.75)
... axs[0, 0].set_title('stepfilled')
...
... axs[0, 1].hist(x, 20, density=True, histtype='step', facecolor='g',
... alpha=0.75)
... axs[0, 1].set_title('step')
...
... axs[1, 0].hist(x, density=True, histtype='barstacked', rwidth=0.8)
... axs[1, 0].hist(w, density=True, histtype='barstacked', rwidth=0.8)
... axs[1, 0].set_title('barstacked')
...
... # Create a histogram by providing the bin edges (unequally spaced).
... bins = [100, 150, 180, 195, 205, 220, 250, 300]
... axs[1, 1].hist(x, bins, density=True, histtype='bar', rwidth=0.8)
... axs[1, 1].set_title('bar, unequal bins')
...
... fig.tight_layout()
... plt.show()
...
... #############################################################################
... #
... # .. admonition:: References
... #
... # The use of the following functions, methods, classes and modules is shown
... # in this example:
... #
... # - `matplotlib.axes.Axes.hist` / `matplotlib.pyplot.hist`
...