>>> """
==============================
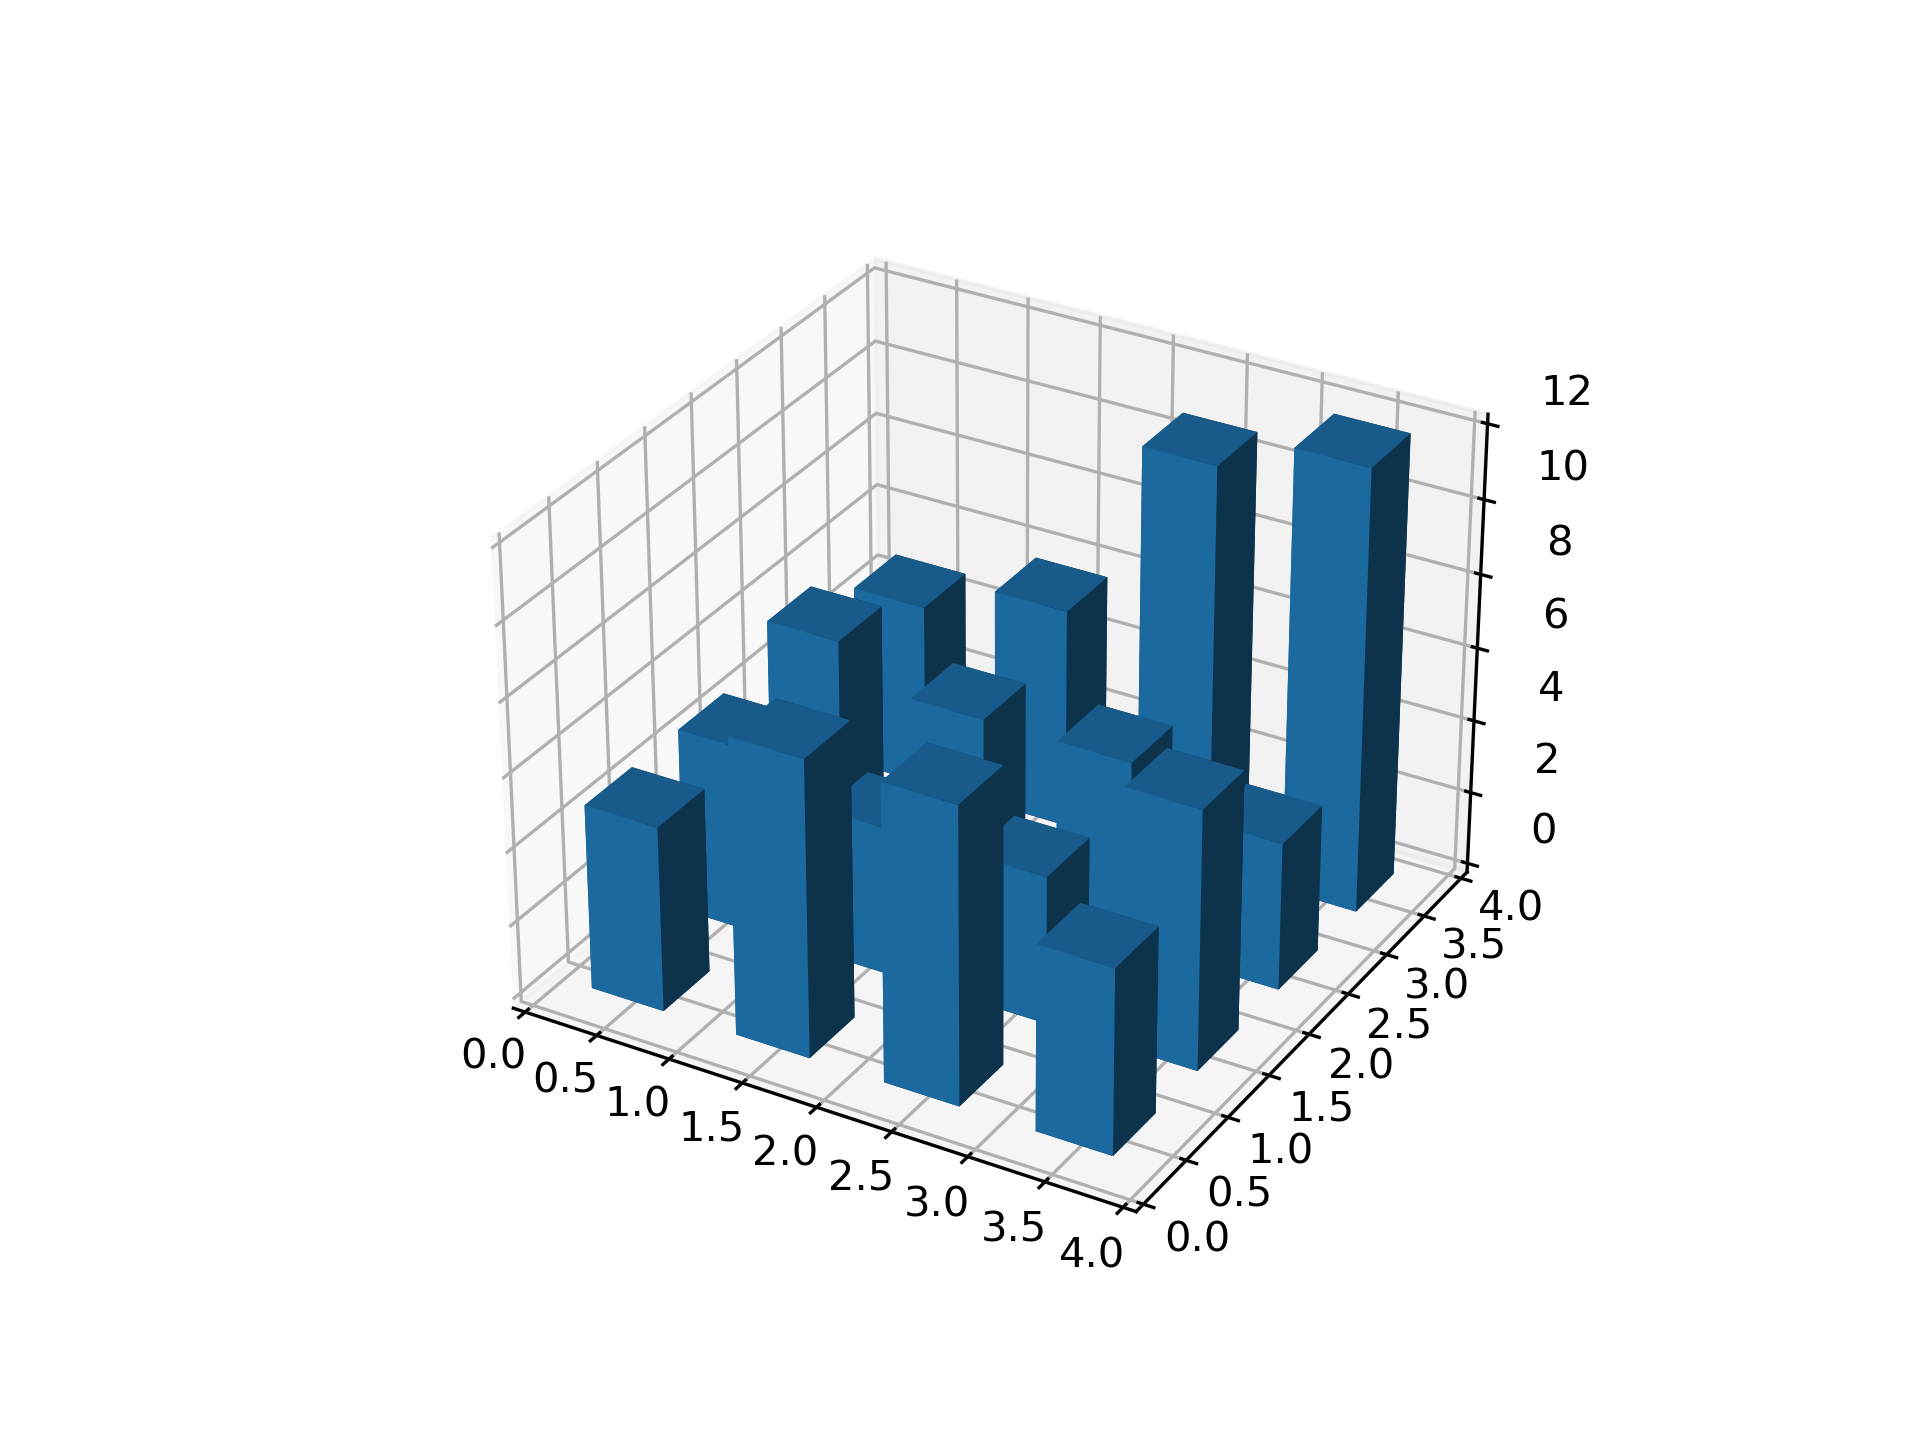
Create 3D histogram of 2D data
==============================
Demo of a histogram for 2 dimensional data as a bar graph in 3D.
"""
...
... import matplotlib.pyplot as plt
... import numpy as np
...
... # Fixing random state for reproducibility
... np.random.seed(19680801)
...
...
... fig = plt.figure()
... ax = fig.add_subplot(projection='3d')
... x, y = np.random.rand(2, 100) * 4
... hist, xedges, yedges = np.histogram2d(x, y, bins=4, range=[[0, 4], [0, 4]])
...
... # Construct arrays for the anchor positions of the 16 bars.
... xpos, ypos = np.meshgrid(xedges[:-1] + 0.25, yedges[:-1] + 0.25, indexing="ij")
... xpos = xpos.ravel()
... ypos = ypos.ravel()
... zpos = 0
...
... # Construct arrays with the dimensions for the 16 bars.
... dx = dy = 0.5 * np.ones_like(zpos)
... dz = hist.ravel()
...
... ax.bar3d(xpos, ypos, zpos, dx, dy, dz, zsort='average')
...
... plt.show()
...