>>> """
=====================
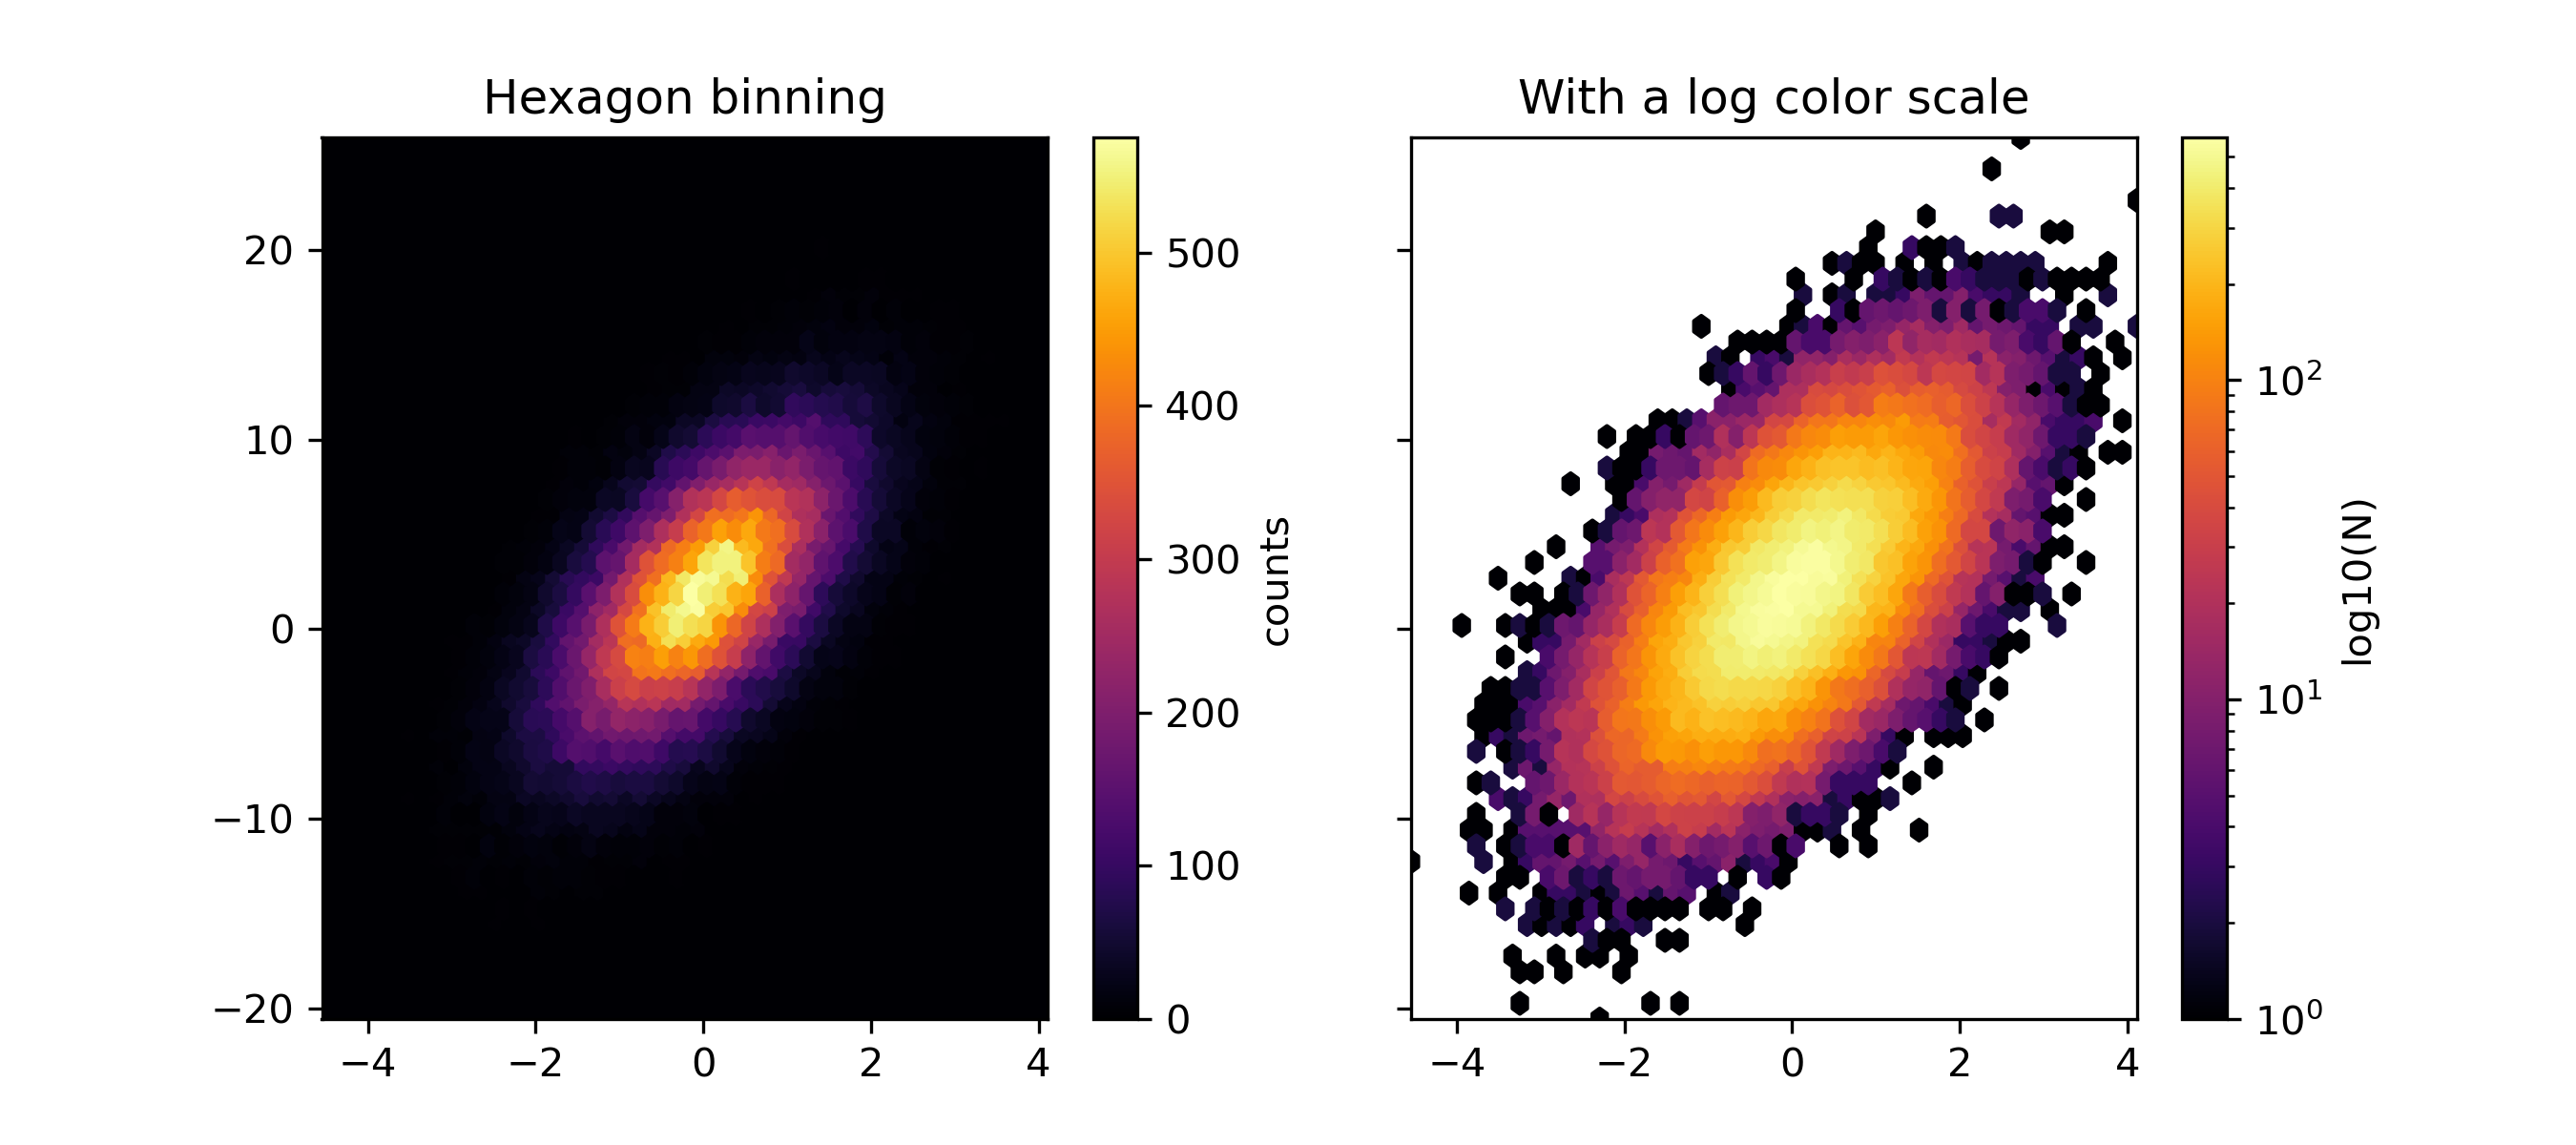
Hexagonal binned plot
=====================
`~.Axes.hexbin` is a 2D histogram plot, in which the bins are hexagons and
the color represents the number of data points within each bin.
"""
...
... import numpy as np
... import matplotlib.pyplot as plt
...
... # Fixing random state for reproducibility
... np.random.seed(19680801)
...
... n = 100_000
... x = np.random.standard_normal(n)
... y = 2.0 + 3.0 * x + 4.0 * np.random.standard_normal(n)
... xlim = x.min(), x.max()
... ylim = y.min(), y.max()
...
... fig, (ax0, ax1) = plt.subplots(ncols=2, sharey=True, figsize=(9, 4))
...
... hb = ax0.hexbin(x, y, gridsize=50, cmap='inferno')
... ax0.set(xlim=xlim, ylim=ylim)
... ax0.set_title("Hexagon binning")
... cb = fig.colorbar(hb, ax=ax0, label='counts')
...
... hb = ax1.hexbin(x, y, gridsize=50, bins='log', cmap='inferno')
... ax1.set(xlim=xlim, ylim=ylim)
... ax1.set_title("With a log color scale")
... cb = fig.colorbar(hb, ax=ax1, label='log10(N)')
...
... plt.show()
...
... #############################################################################
... #
... # .. admonition:: References
... #
... # The use of the following functions, methods, classes and modules is shown
... # in this example:
... #
... # - `matplotlib.axes.Axes.hexbin` / `matplotlib.pyplot.hexbin`
...