>>> """
=========
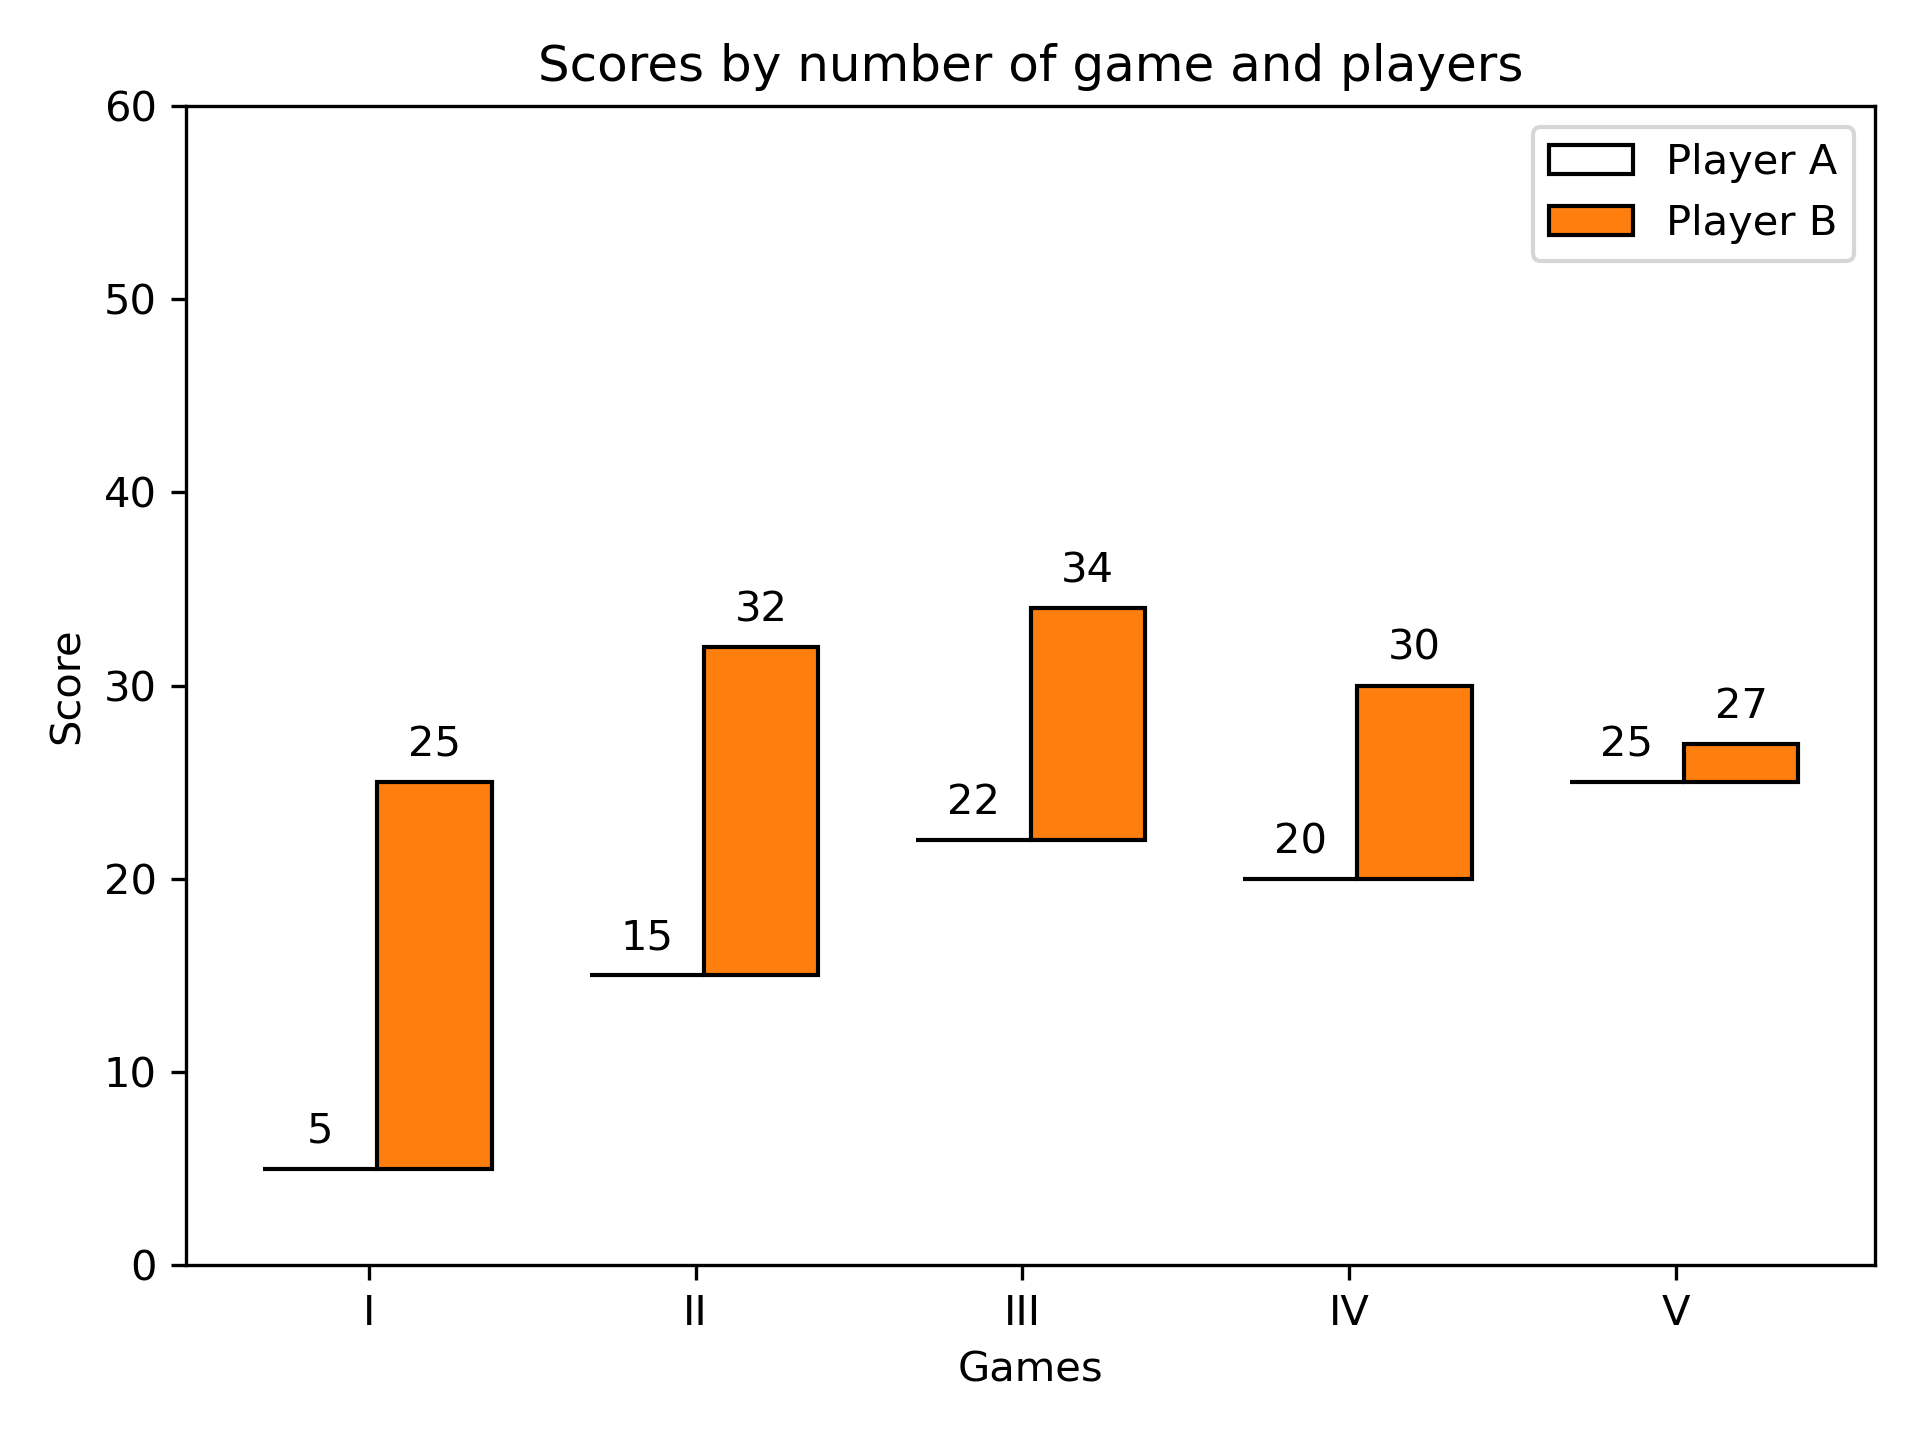
Hat graph
=========
This example shows how to create a `hat graph`_ and how to annotate it with
labels.
.. _hat graph: https://doi.org/10.1186/s41235-019-0182-3
"""
... import numpy as np
... import matplotlib.pyplot as plt
...
...
... def hat_graph(ax, xlabels, values, group_labels):
... """
Create a hat graph.
Parameters
----------
ax : matplotlib.axes.Axes
The Axes to plot into.
xlabels : list of str
The category names to be displayed on the x-axis.
values : (M, N) array-like
The data values.
Rows are the groups (len(group_labels) == M).
Columns are the categories (len(xlabels) == N).
group_labels : list of str
The group labels displayed in the legend.
"""
...
... def label_bars(heights, rects):
... """Attach a text label on top of each bar."""
... for height, rect in zip(heights, rects):
... ax.annotate(f'{height}',
... xy=(rect.get_x() + rect.get_width() / 2, height),
... xytext=(0, 4), # 4 points vertical offset.
... textcoords='offset points',
... ha='center', va='bottom')
...
... values = np.asarray(values)
... x = np.arange(values.shape[1])
... ax.set_xticks(x, labels=xlabels)
... spacing = 0.3 # spacing between hat groups
... width = (1 - spacing) / values.shape[0]
... heights0 = values[0]
... for i, (heights, group_label) in enumerate(zip(values, group_labels)):
... style = {'fill': False} if i == 0 else {'edgecolor': 'black'}
... rects = ax.bar(x - spacing/2 + i * width, heights - heights0,
... width, bottom=heights0, label=group_label, **style)
... label_bars(heights, rects)
...
...
... # initialise labels and a numpy array make sure you have
... # N labels of N number of values in the array
... xlabels = ['I', 'II', 'III', 'IV', 'V']
... playerA = np.array([5, 15, 22, 20, 25])
... playerB = np.array([25, 32, 34, 30, 27])
...
... fig, ax = plt.subplots()
... hat_graph(ax, xlabels, [playerA, playerB], ['Player A', 'Player B'])
...
... # Add some text for labels, title and custom x-axis tick labels, etc.
... ax.set_xlabel('Games')
... ax.set_ylabel('Score')
... ax.set_ylim(0, 60)
... ax.set_title('Scores by number of game and players')
... ax.legend()
...
... fig.tight_layout()
... plt.show()
... #############################################################################
... #
... # .. admonition:: References
... #
... # The use of the following functions, methods, classes and modules is shown
... # in this example:
... #
... # - `matplotlib.axes.Axes.bar` / `matplotlib.pyplot.bar`
... # - `matplotlib.axes.Axes.annotate` / `matplotlib.pyplot.annotate`
...