>>> """
=======================================================
Using Gridspec to make multi-column/row subplot layouts
=======================================================
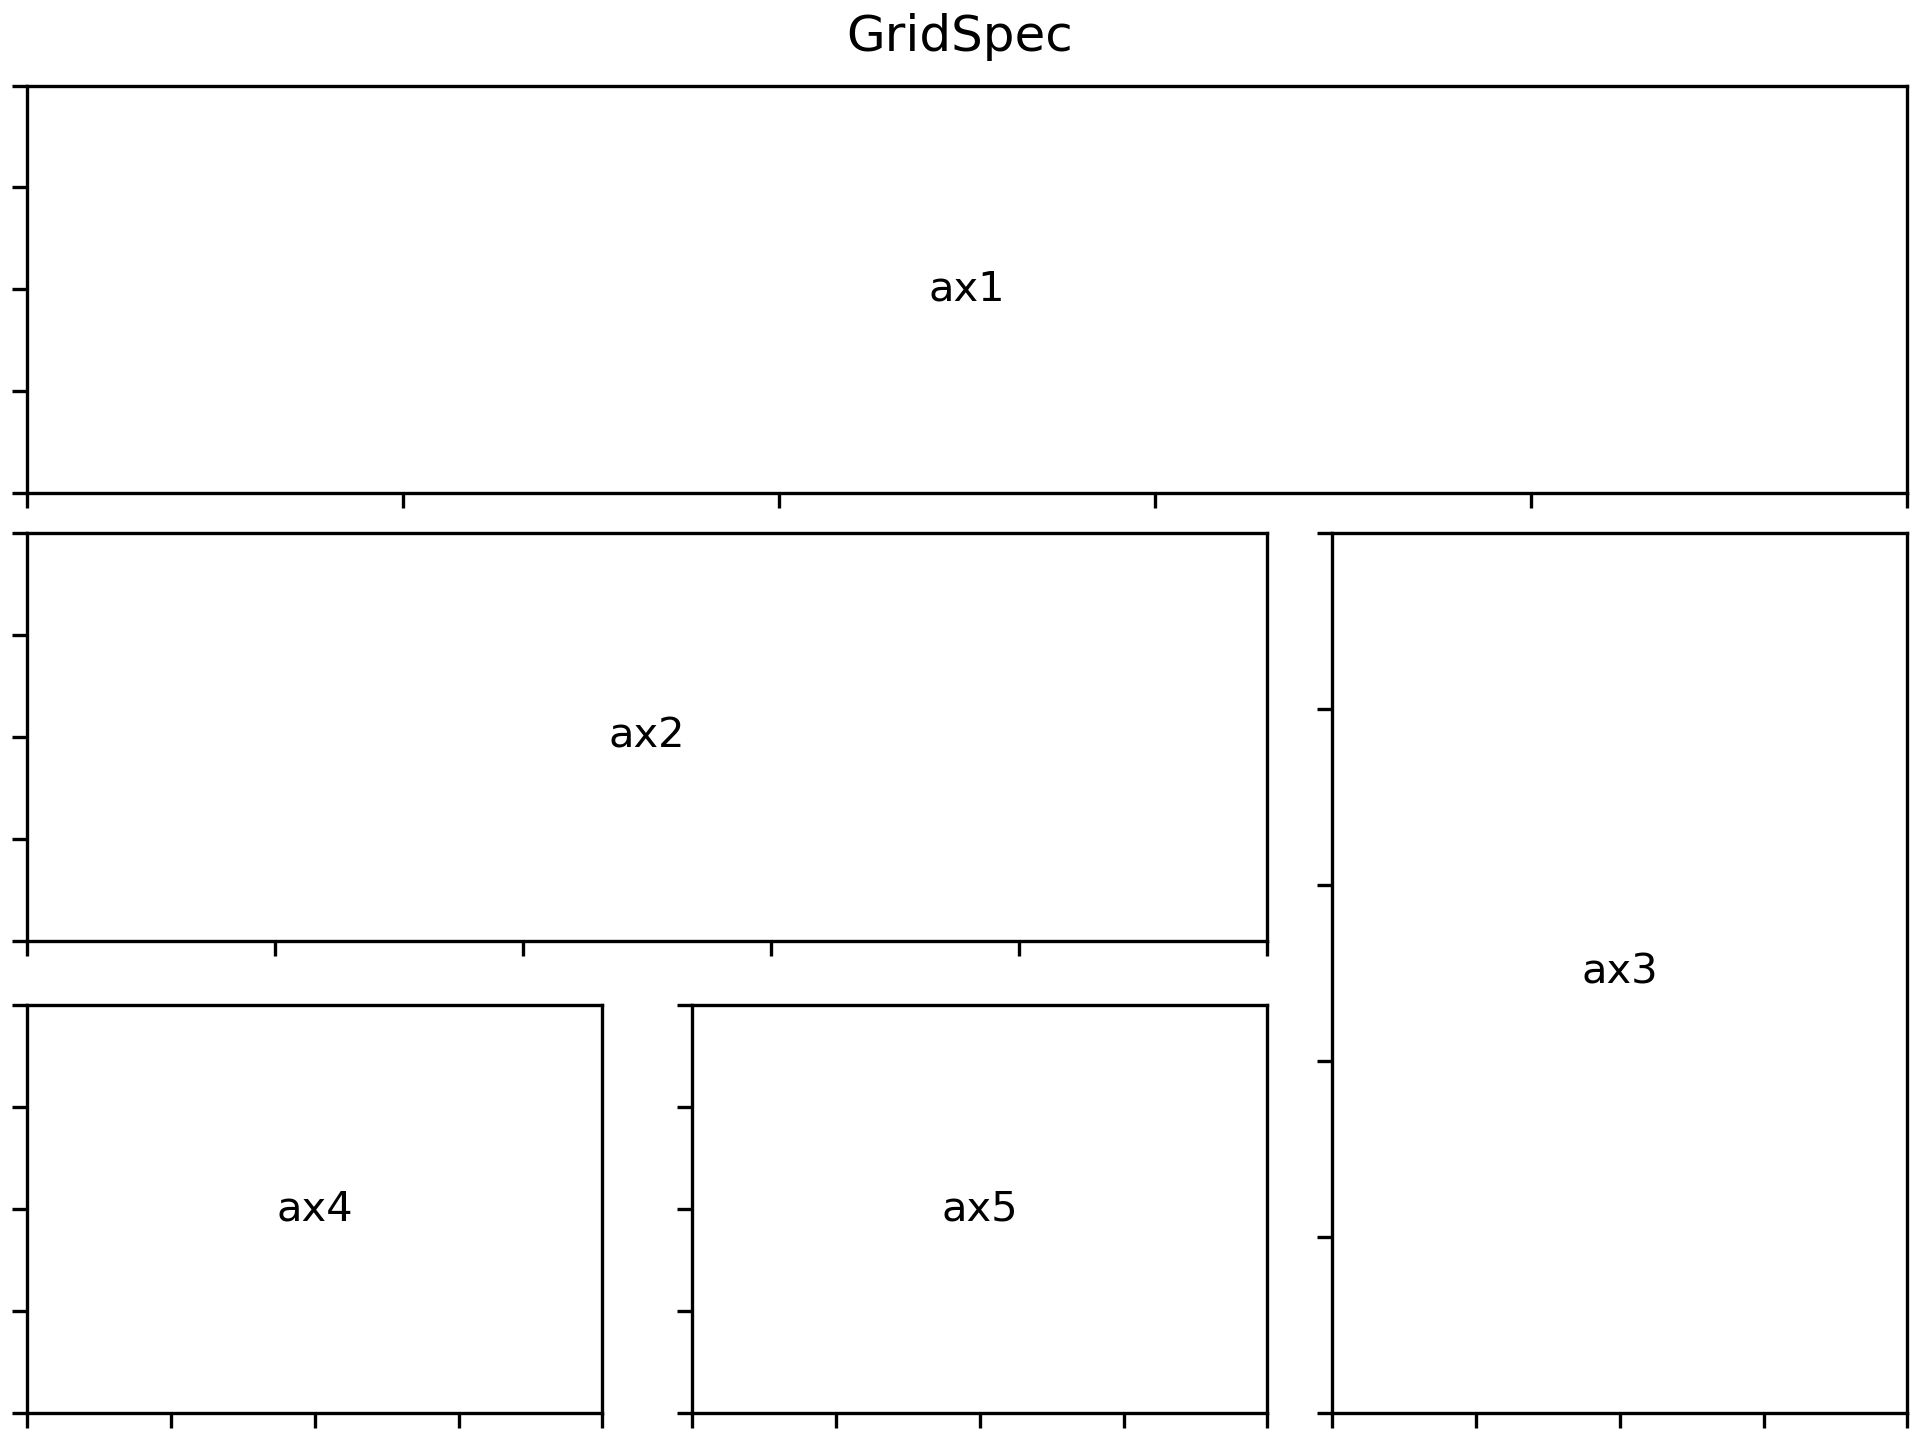
`.GridSpec` is a flexible way to layout
subplot grids. Here is an example with a 3x3 grid, and
axes spanning all three columns, two columns, and two rows.
"""
... import matplotlib.pyplot as plt
... from matplotlib.gridspec import GridSpec
...
...
... def format_axes(fig):
... for i, ax in enumerate(fig.axes):
... ax.text(0.5, 0.5, "ax%d" % (i+1), va="center", ha="center")
... ax.tick_params(labelbottom=False, labelleft=False)
...
... fig = plt.figure(constrained_layout=True)
...
... gs = GridSpec(3, 3, figure=fig)
... ax1 = fig.add_subplot(gs[0, :])
... # identical to ax1 = plt.subplot(gs.new_subplotspec((0, 0), colspan=3))
... ax2 = fig.add_subplot(gs[1, :-1])
... ax3 = fig.add_subplot(gs[1:, -1])
... ax4 = fig.add_subplot(gs[-1, 0])
... ax5 = fig.add_subplot(gs[-1, -2])
...
... fig.suptitle("GridSpec")
... format_axes(fig)
...
... plt.show()
...