>>> """
==================================================
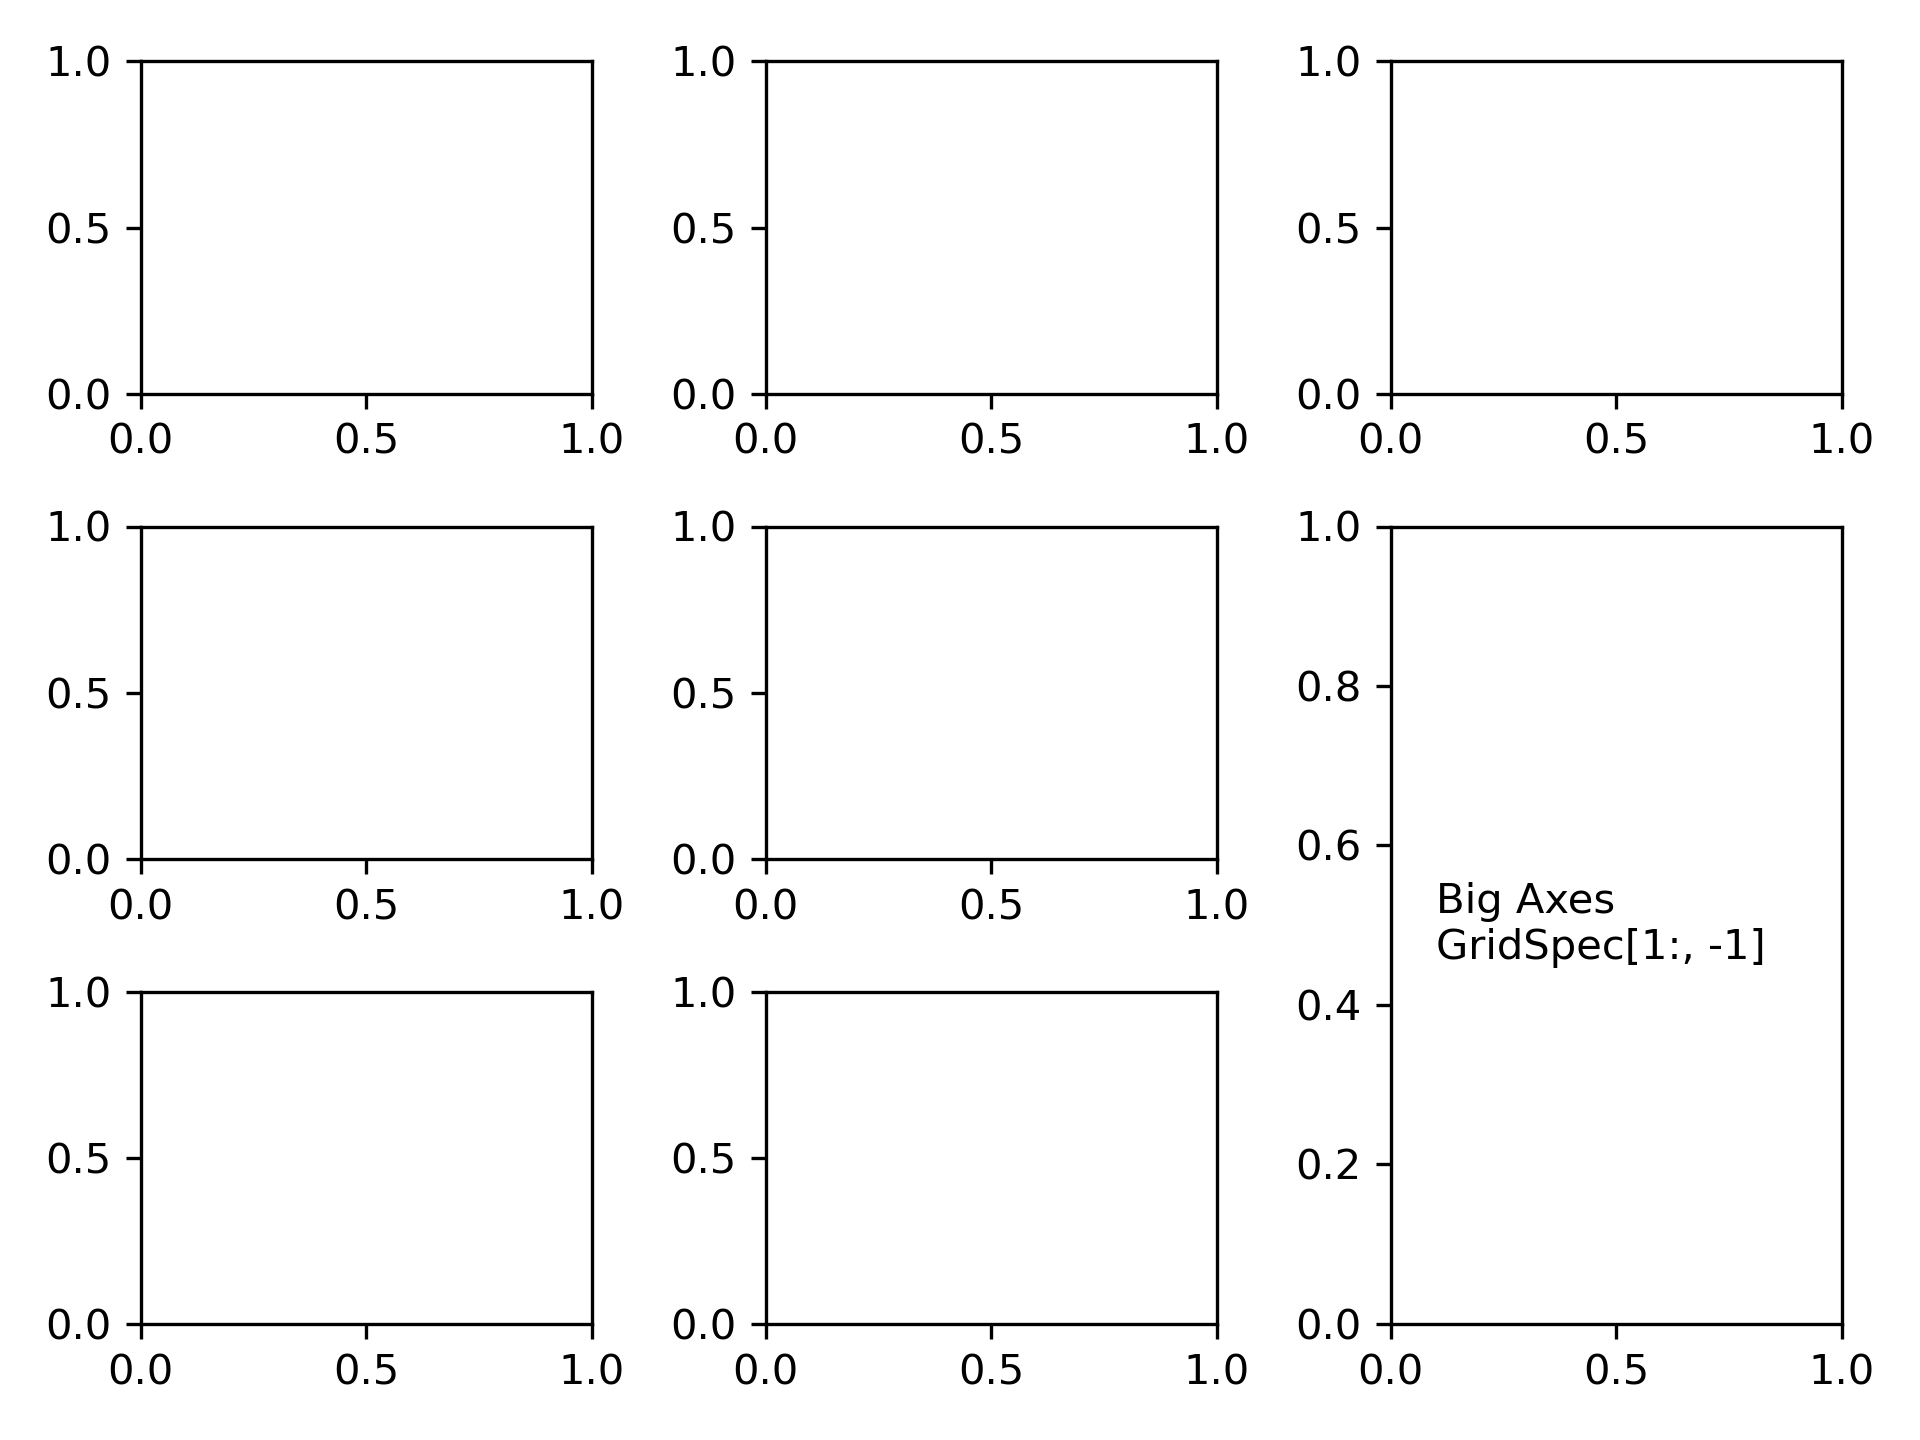
Combining two subplots using subplots and GridSpec
==================================================
Sometimes we want to combine two subplots in an axes layout created with
`~.Figure.subplots`. We can get the `~.gridspec.GridSpec` from the axes
and then remove the covered axes and fill the gap with a new bigger axes.
Here we create a layout with the bottom two axes in the last column combined.
To start with this layout (rather than removing the overlapping axes) use
`~.pyplot.subplot_mosaic`.
See also :doc:`/tutorials/intermediate/arranging_axes`.
"""
...
... import matplotlib.pyplot as plt
...
... fig, axs = plt.subplots(ncols=3, nrows=3)
... gs = axs[1, 2].get_gridspec()
... # remove the underlying axes
... for ax in axs[1:, -1]:
... ax.remove()
... axbig = fig.add_subplot(gs[1:, -1])
... axbig.annotate('Big Axes \nGridSpec[1:, -1]', (0.1, 0.5),
... xycoords='axes fraction', va='center')
...
... fig.tight_layout()
...
... plt.show()
...