>>> """
=====================
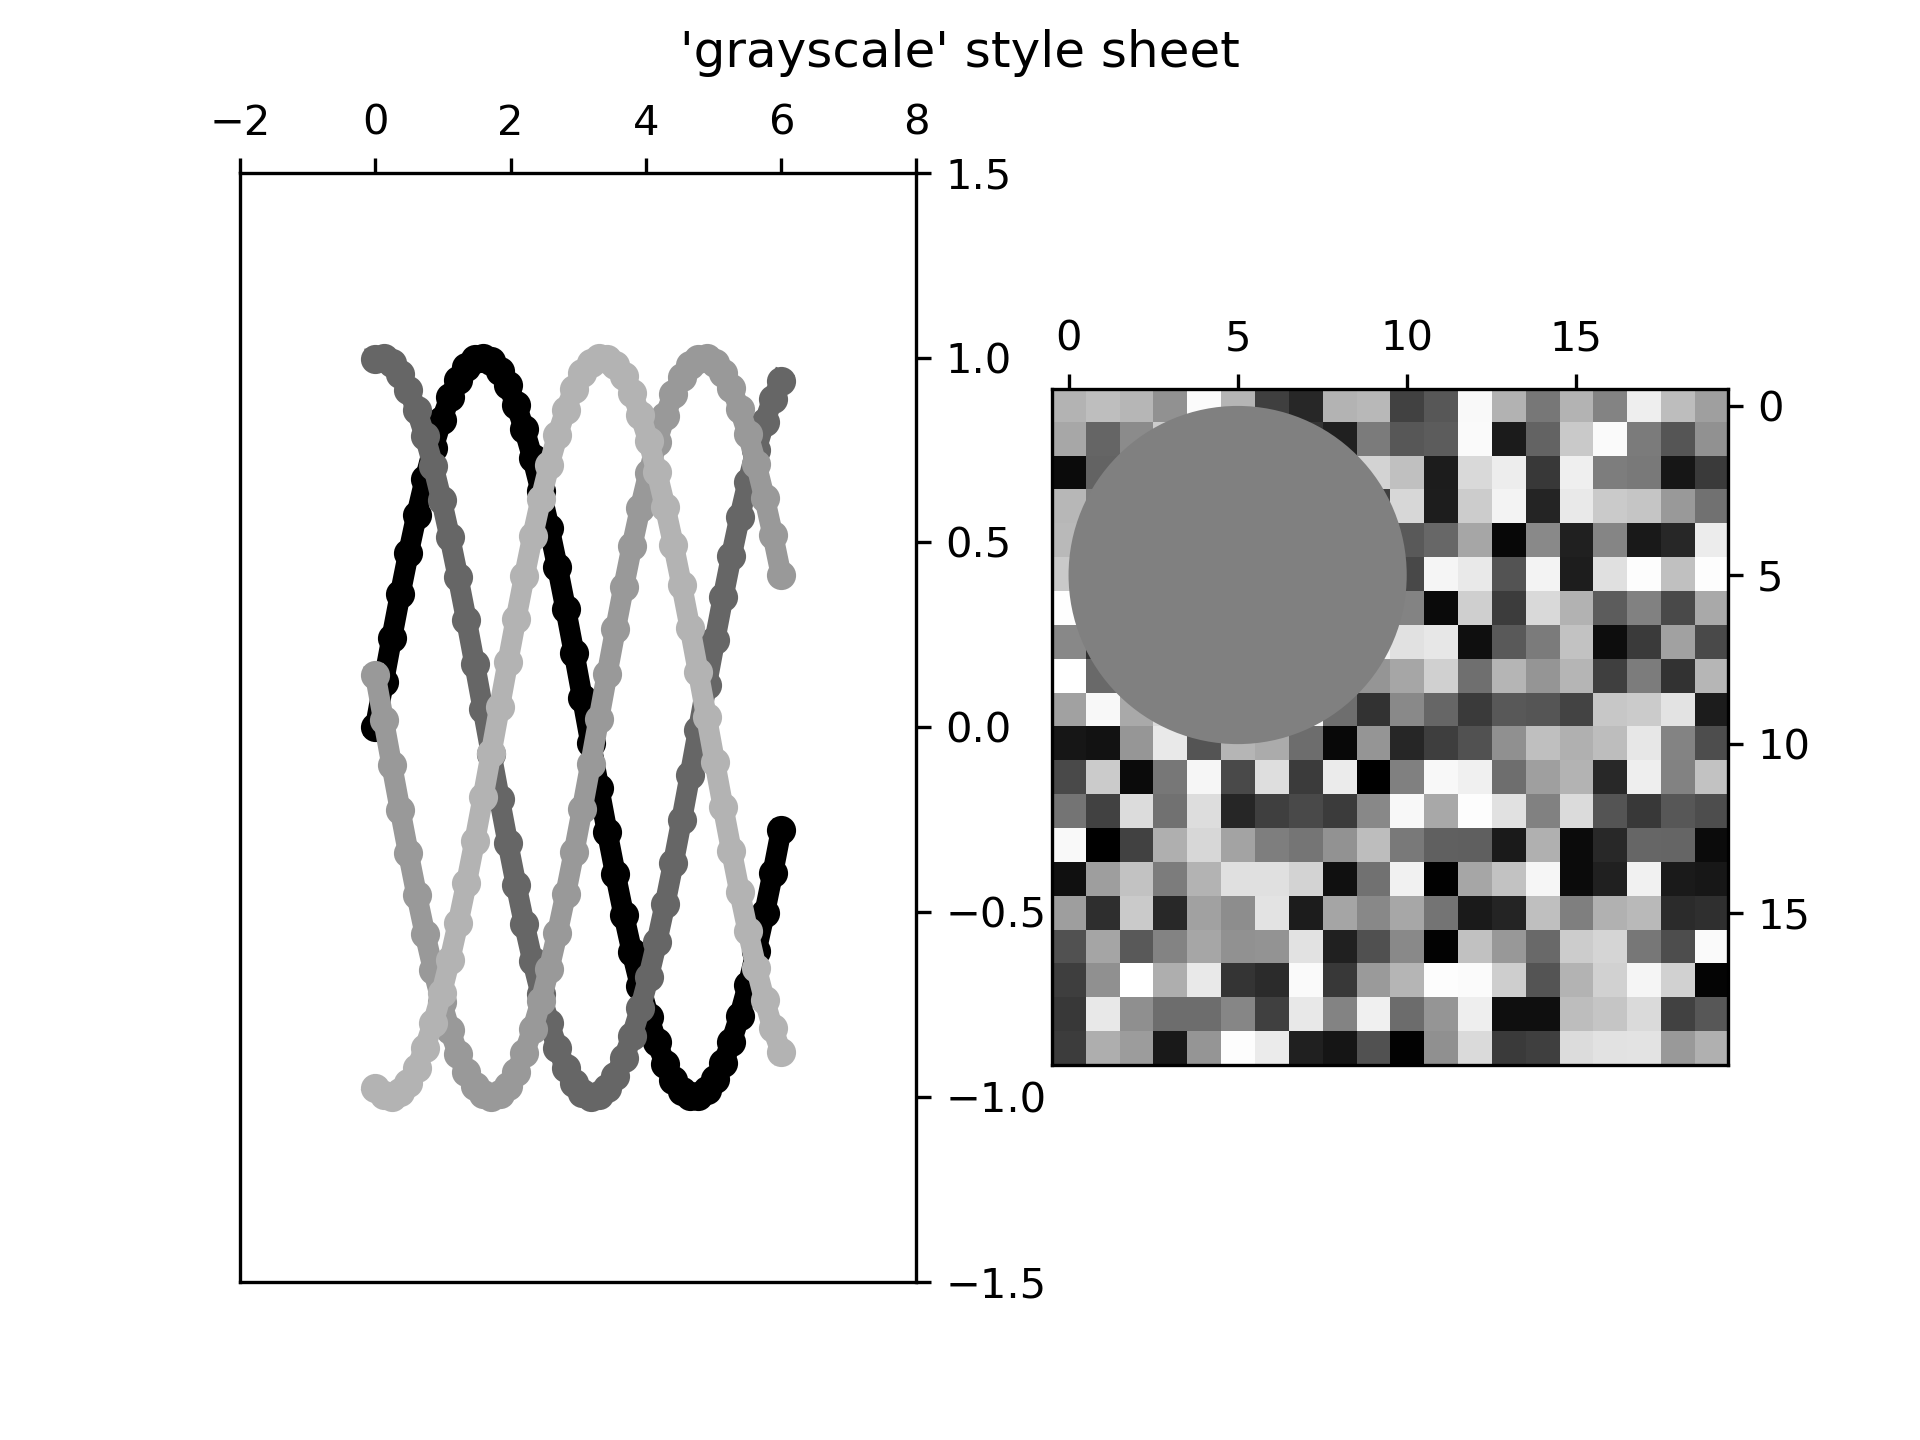
Grayscale style sheet
=====================
This example demonstrates the "grayscale" style sheet, which changes all colors
that are defined as `.rcParams` to grayscale. Note, however, that not all
plot elements respect `.rcParams`.
"""
...
... import numpy as np
... import matplotlib.pyplot as plt
...
... # Fixing random state for reproducibility
... np.random.seed(19680801)
...
...
... def color_cycle_example(ax):
... L = 6
... x = np.linspace(0, L)
... ncolors = len(plt.rcParams['axes.prop_cycle'])
... shift = np.linspace(0, L, ncolors, endpoint=False)
... for s in shift:
... ax.plot(x, np.sin(x + s), 'o-')
...
...
... def image_and_patch_example(ax):
... ax.imshow(np.random.random(size=(20, 20)), interpolation='none')
... c = plt.Circle((5, 5), radius=5, label='patch')
... ax.add_patch(c)
...
...
... plt.style.use('grayscale')
...
... fig, (ax1, ax2) = plt.subplots(ncols=2)
... fig.suptitle("'grayscale' style sheet")
...
... color_cycle_example(ax1)
... image_and_patch_example(ax2)
...
... plt.show()
...