>>> """
======================
Geographic Projections
======================
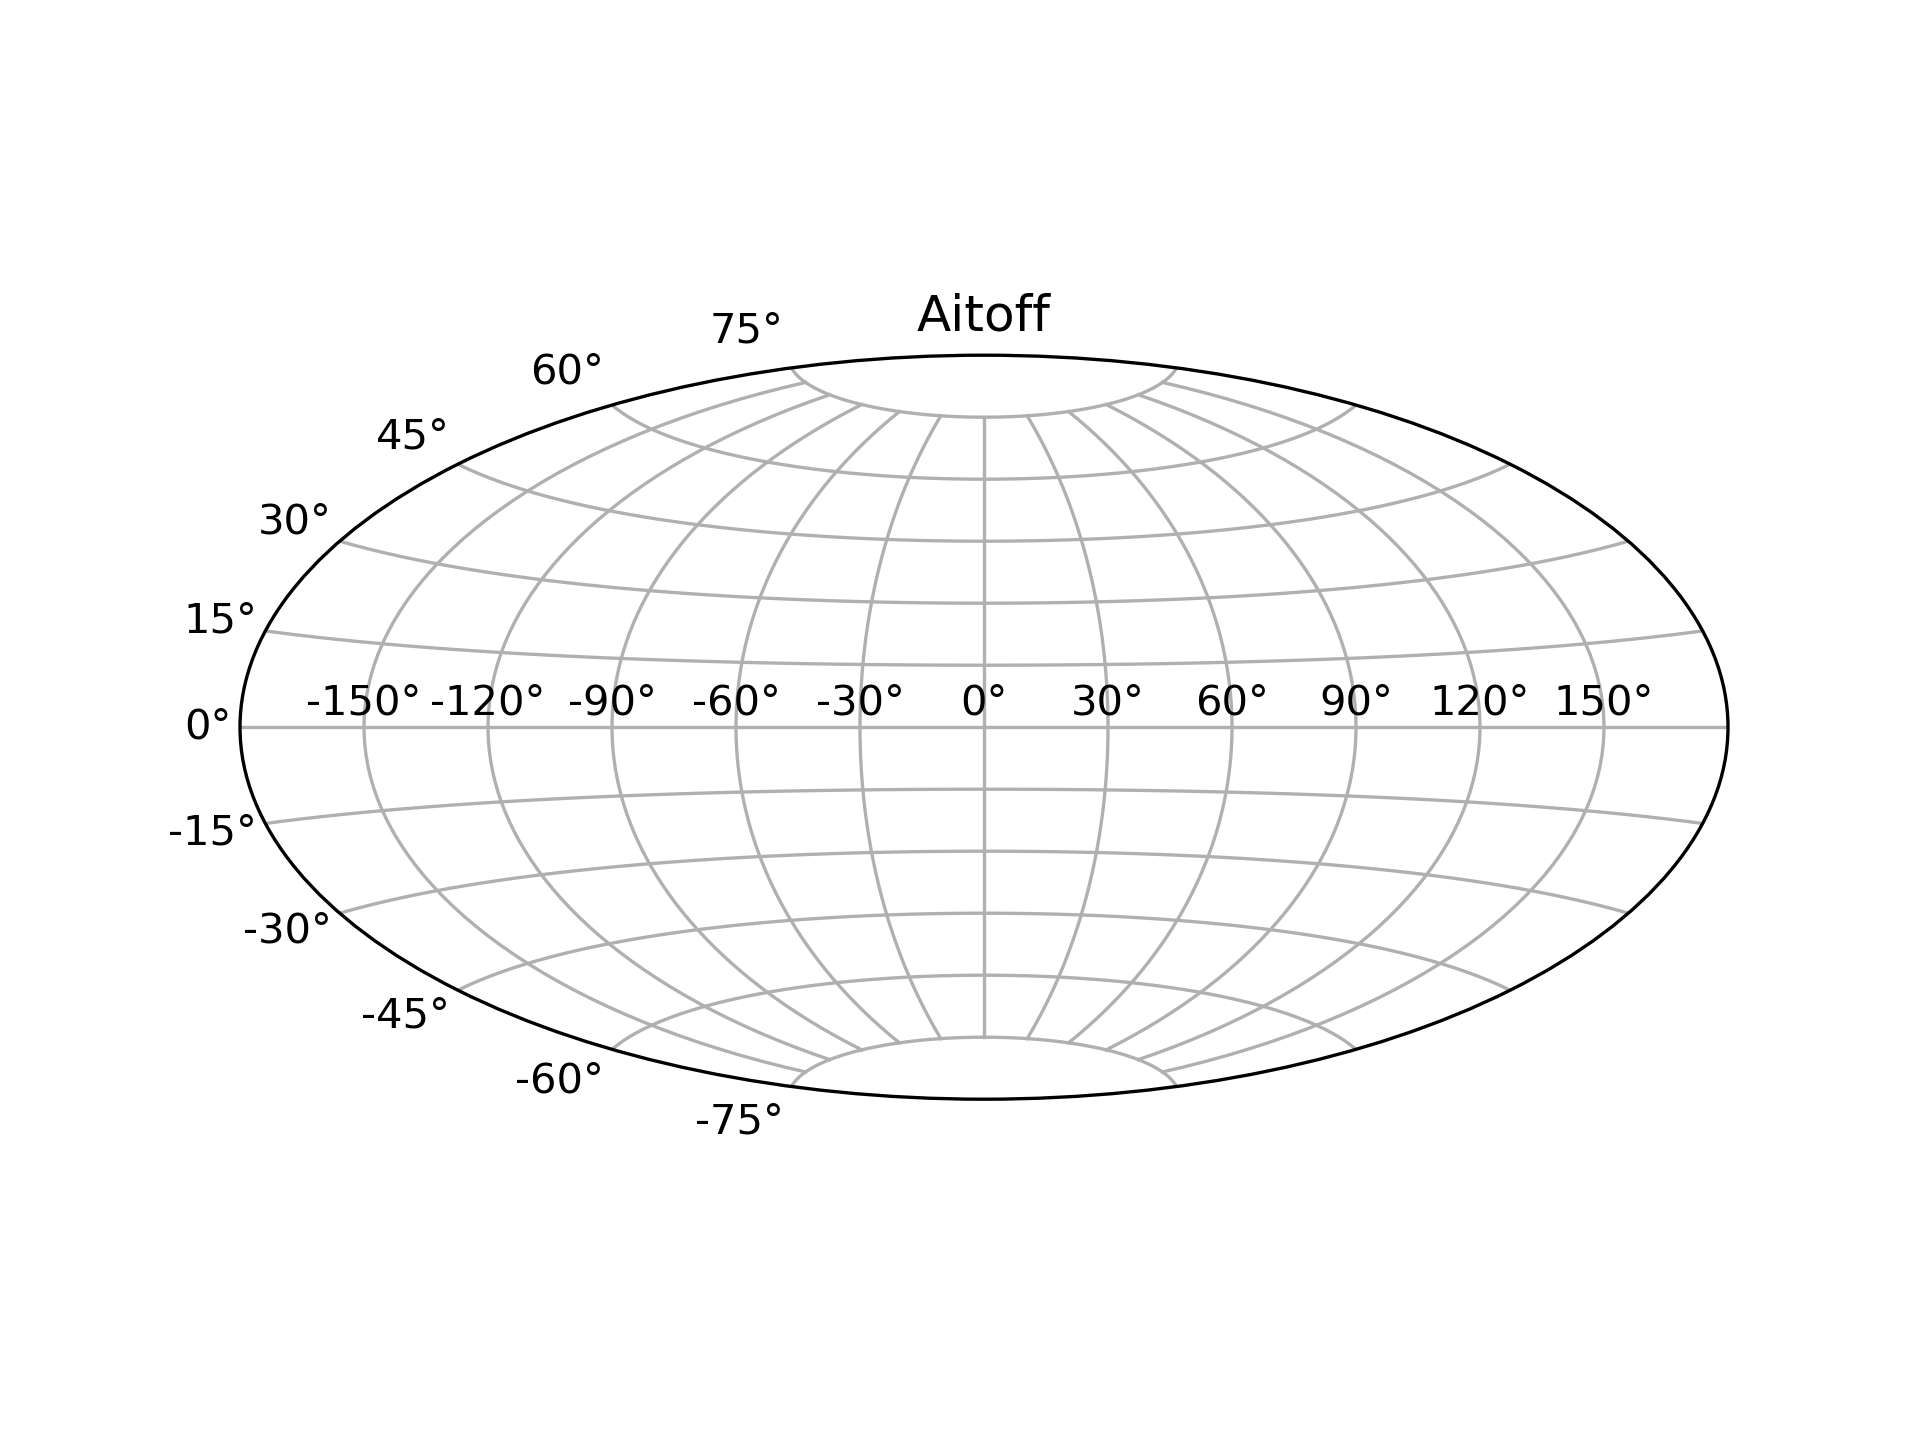
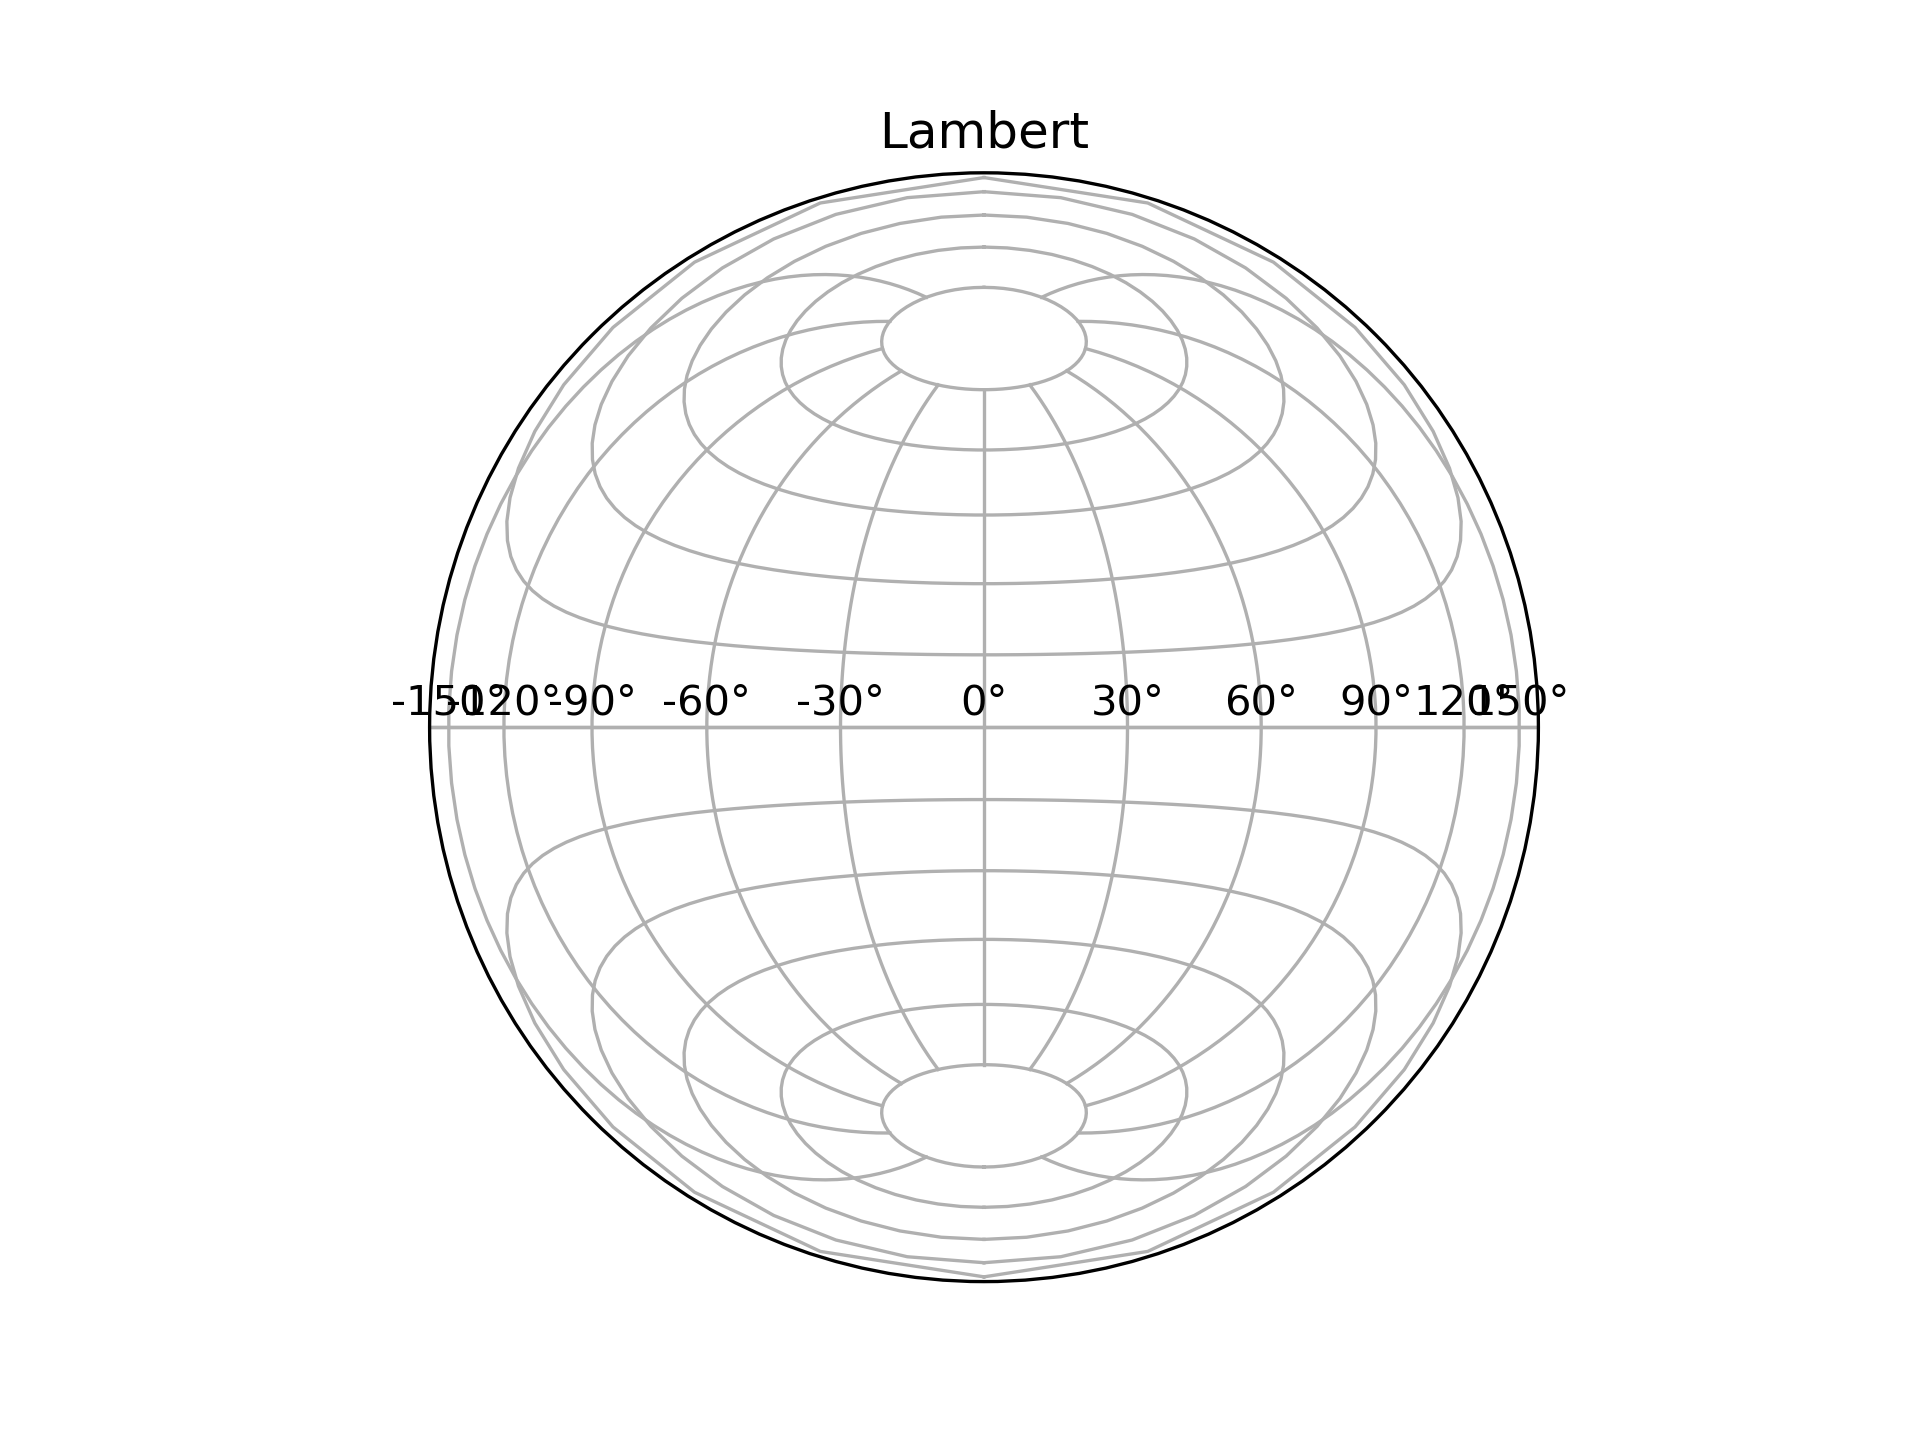
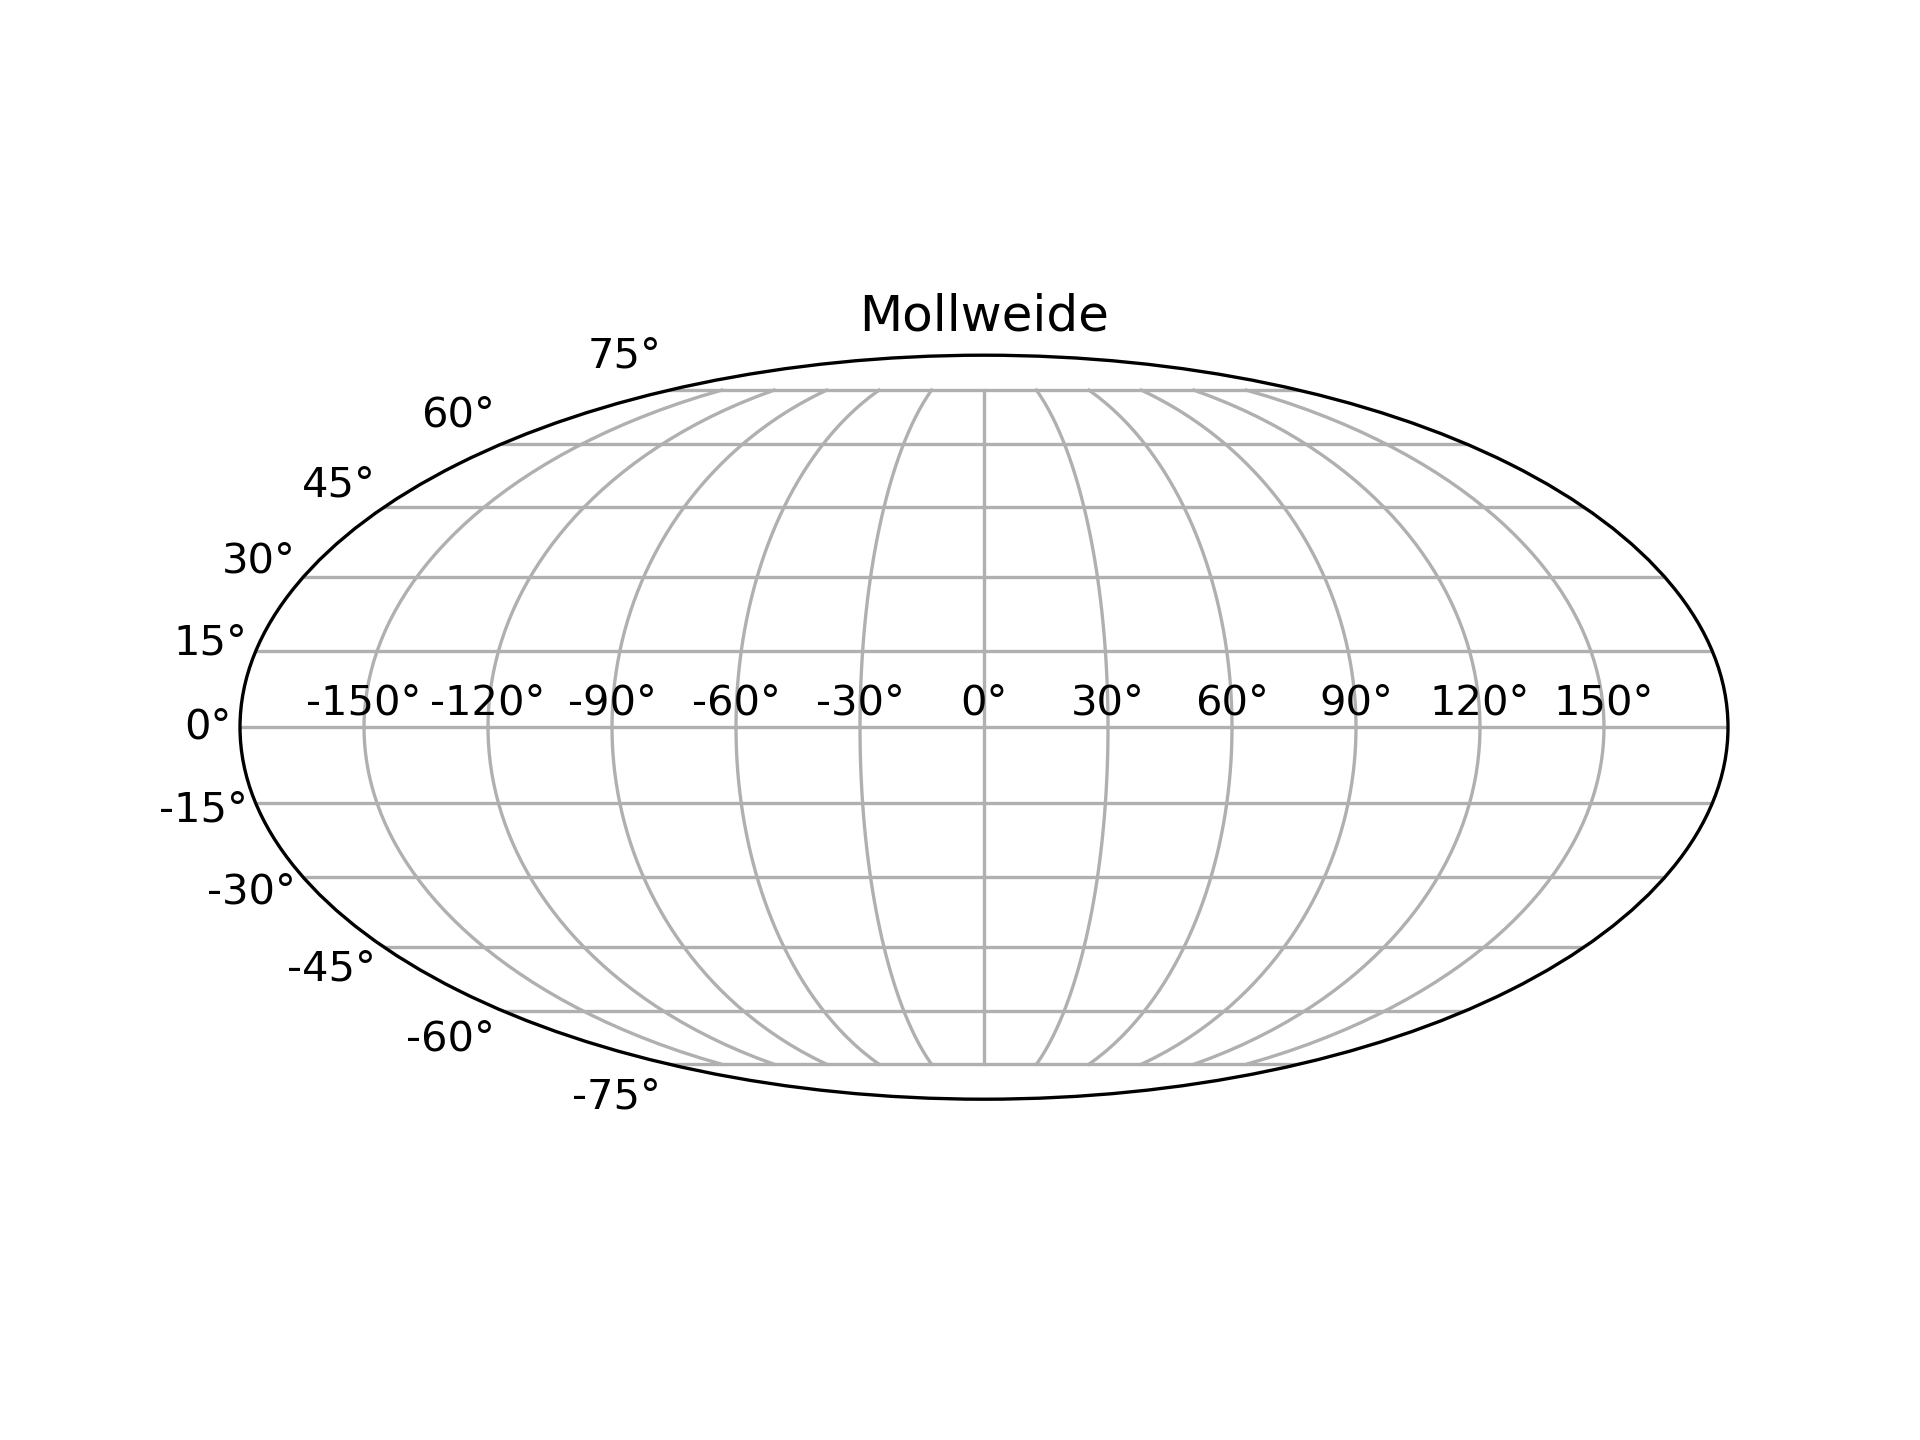
This shows 4 possible geographic projections. Cartopy_ supports more
projections.
.. _Cartopy: https://scitools.org.uk/cartopy/
"""
...
... import matplotlib.pyplot as plt
...
... ###############################################################################
...
... plt.figure()
... plt.subplot(projection="aitoff")
... plt.title("Aitoff")
... plt.grid(True)
...
... ###############################################################################
...
... plt.figure()
... plt.subplot(projection="hammer")
... plt.title("Hammer")
... plt.grid(True)
...
... ###############################################################################
...
... plt.figure()
... plt.subplot(projection="lambert")
... plt.title("Lambert")
... plt.grid(True)
...
... ###############################################################################
...
... plt.figure()
... plt.subplot(projection="mollweide")
... plt.title("Mollweide")
... plt.grid(True)
...
... plt.show()
...