>>> """
=========================
Hatch-filled histograms
=========================
Hatching capabilities for plotting histograms.
"""
...
... import itertools
... from functools import partial
...
... import numpy as np
... import matplotlib.pyplot as plt
... import matplotlib.ticker as mticker
... from cycler import cycler
...
...
... def filled_hist(ax, edges, values, bottoms=None, orientation='v',
... **kwargs):
... """
Draw a histogram as a stepped patch.
Parameters
----------
ax : Axes
The axes to plot to
edges : array
A length n+1 array giving the left edges of each bin and the
right edge of the last bin.
values : array
A length n array of bin counts or values
bottoms : float or array, optional
A length n array of the bottom of the bars. If None, zero is used.
orientation : {'v', 'h'}
Orientation of the histogram. 'v' (default) has
the bars increasing in the positive y-direction.
**kwargs
Extra keyword arguments are passed through to `.fill_between`.
Returns
-------
ret : PolyCollection
Artist added to the Axes
"""
... print(orientation)
... if orientation not in 'hv':
... raise ValueError("orientation must be in {{'h', 'v'}} "
... "not {o}".format(o=orientation))
...
... kwargs.setdefault('step', 'post')
... kwargs.setdefault('alpha', 0.7)
... edges = np.asarray(edges)
... values = np.asarray(values)
... if len(edges) - 1 != len(values):
... raise ValueError('Must provide one more bin edge than value not: '
... 'len(edges): {lb} len(values): {lv}'.format(
... lb=len(edges), lv=len(values)))
...
... if bottoms is None:
... bottoms = 0
... bottoms = np.broadcast_to(bottoms, values.shape)
...
... values = np.append(values, values[-1])
... bottoms = np.append(bottoms, bottoms[-1])
... if orientation == 'h':
... return ax.fill_betweenx(edges, values, bottoms,
... **kwargs)
... elif orientation == 'v':
... return ax.fill_between(edges, values, bottoms,
... **kwargs)
... else:
... raise AssertionError("you should never be here")
...
...
... def stack_hist(ax, stacked_data, sty_cycle, bottoms=None,
... hist_func=None, labels=None,
... plot_func=None, plot_kwargs=None):
... """
Parameters
----------
ax : axes.Axes
The axes to add artists too
stacked_data : array or Mapping
A (M, N) shaped array. The first dimension will be iterated over to
compute histograms row-wise
sty_cycle : Cycler or operable of dict
Style to apply to each set
bottoms : array, default: 0
The initial positions of the bottoms.
hist_func : callable, optional
Must have signature `bin_vals, bin_edges = f(data)`.
`bin_edges` expected to be one longer than `bin_vals`
labels : list of str, optional
The label for each set.
If not given and stacked data is an array defaults to 'default set {n}'
If *stacked_data* is a mapping, and *labels* is None, default to the
keys.
If *stacked_data* is a mapping and *labels* is given then only the
columns listed will be plotted.
plot_func : callable, optional
Function to call to draw the histogram must have signature:
ret = plot_func(ax, edges, top, bottoms=bottoms,
label=label, **kwargs)
plot_kwargs : dict, optional
Any extra keyword arguments to pass through to the plotting function.
This will be the same for all calls to the plotting function and will
override the values in *sty_cycle*.
Returns
-------
arts : dict
Dictionary of artists keyed on their labels
"""
... # deal with default binning function
... if hist_func is None:
... hist_func = np.histogram
...
... # deal with default plotting function
... if plot_func is None:
... plot_func = filled_hist
...
... # deal with default
... if plot_kwargs is None:
... plot_kwargs = {}
... print(plot_kwargs)
... try:
... l_keys = stacked_data.keys()
... label_data = True
... if labels is None:
... labels = l_keys
...
... except AttributeError:
... label_data = False
... if labels is None:
... labels = itertools.repeat(None)
...
... if label_data:
... loop_iter = enumerate((stacked_data[lab], lab, s)
... for lab, s in zip(labels, sty_cycle))
... else:
... loop_iter = enumerate(zip(stacked_data, labels, sty_cycle))
...
... arts = {}
... for j, (data, label, sty) in loop_iter:
... if label is None:
... label = 'dflt set {n}'.format(n=j)
... label = sty.pop('label', label)
... vals, edges = hist_func(data)
... if bottoms is None:
... bottoms = np.zeros_like(vals)
... top = bottoms + vals
... print(sty)
... sty.update(plot_kwargs)
... print(sty)
... ret = plot_func(ax, edges, top, bottoms=bottoms,
... label=label, **sty)
... bottoms = top
... arts[label] = ret
... ax.legend(fontsize=10)
... return arts
...
...
... # set up histogram function to fixed bins
... edges = np.linspace(-3, 3, 20, endpoint=True)
... hist_func = partial(np.histogram, bins=edges)
...
... # set up style cycles
... color_cycle = cycler(facecolor=plt.rcParams['axes.prop_cycle'][:4])
... label_cycle = cycler(label=['set {n}'.format(n=n) for n in range(4)])
... hatch_cycle = cycler(hatch=['/', '*', '+', '|'])
...
... # Fixing random state for reproducibility
... np.random.seed(19680801)
...
... stack_data = np.random.randn(4, 12250)
... dict_data = dict(zip((c['label'] for c in label_cycle), stack_data))
...
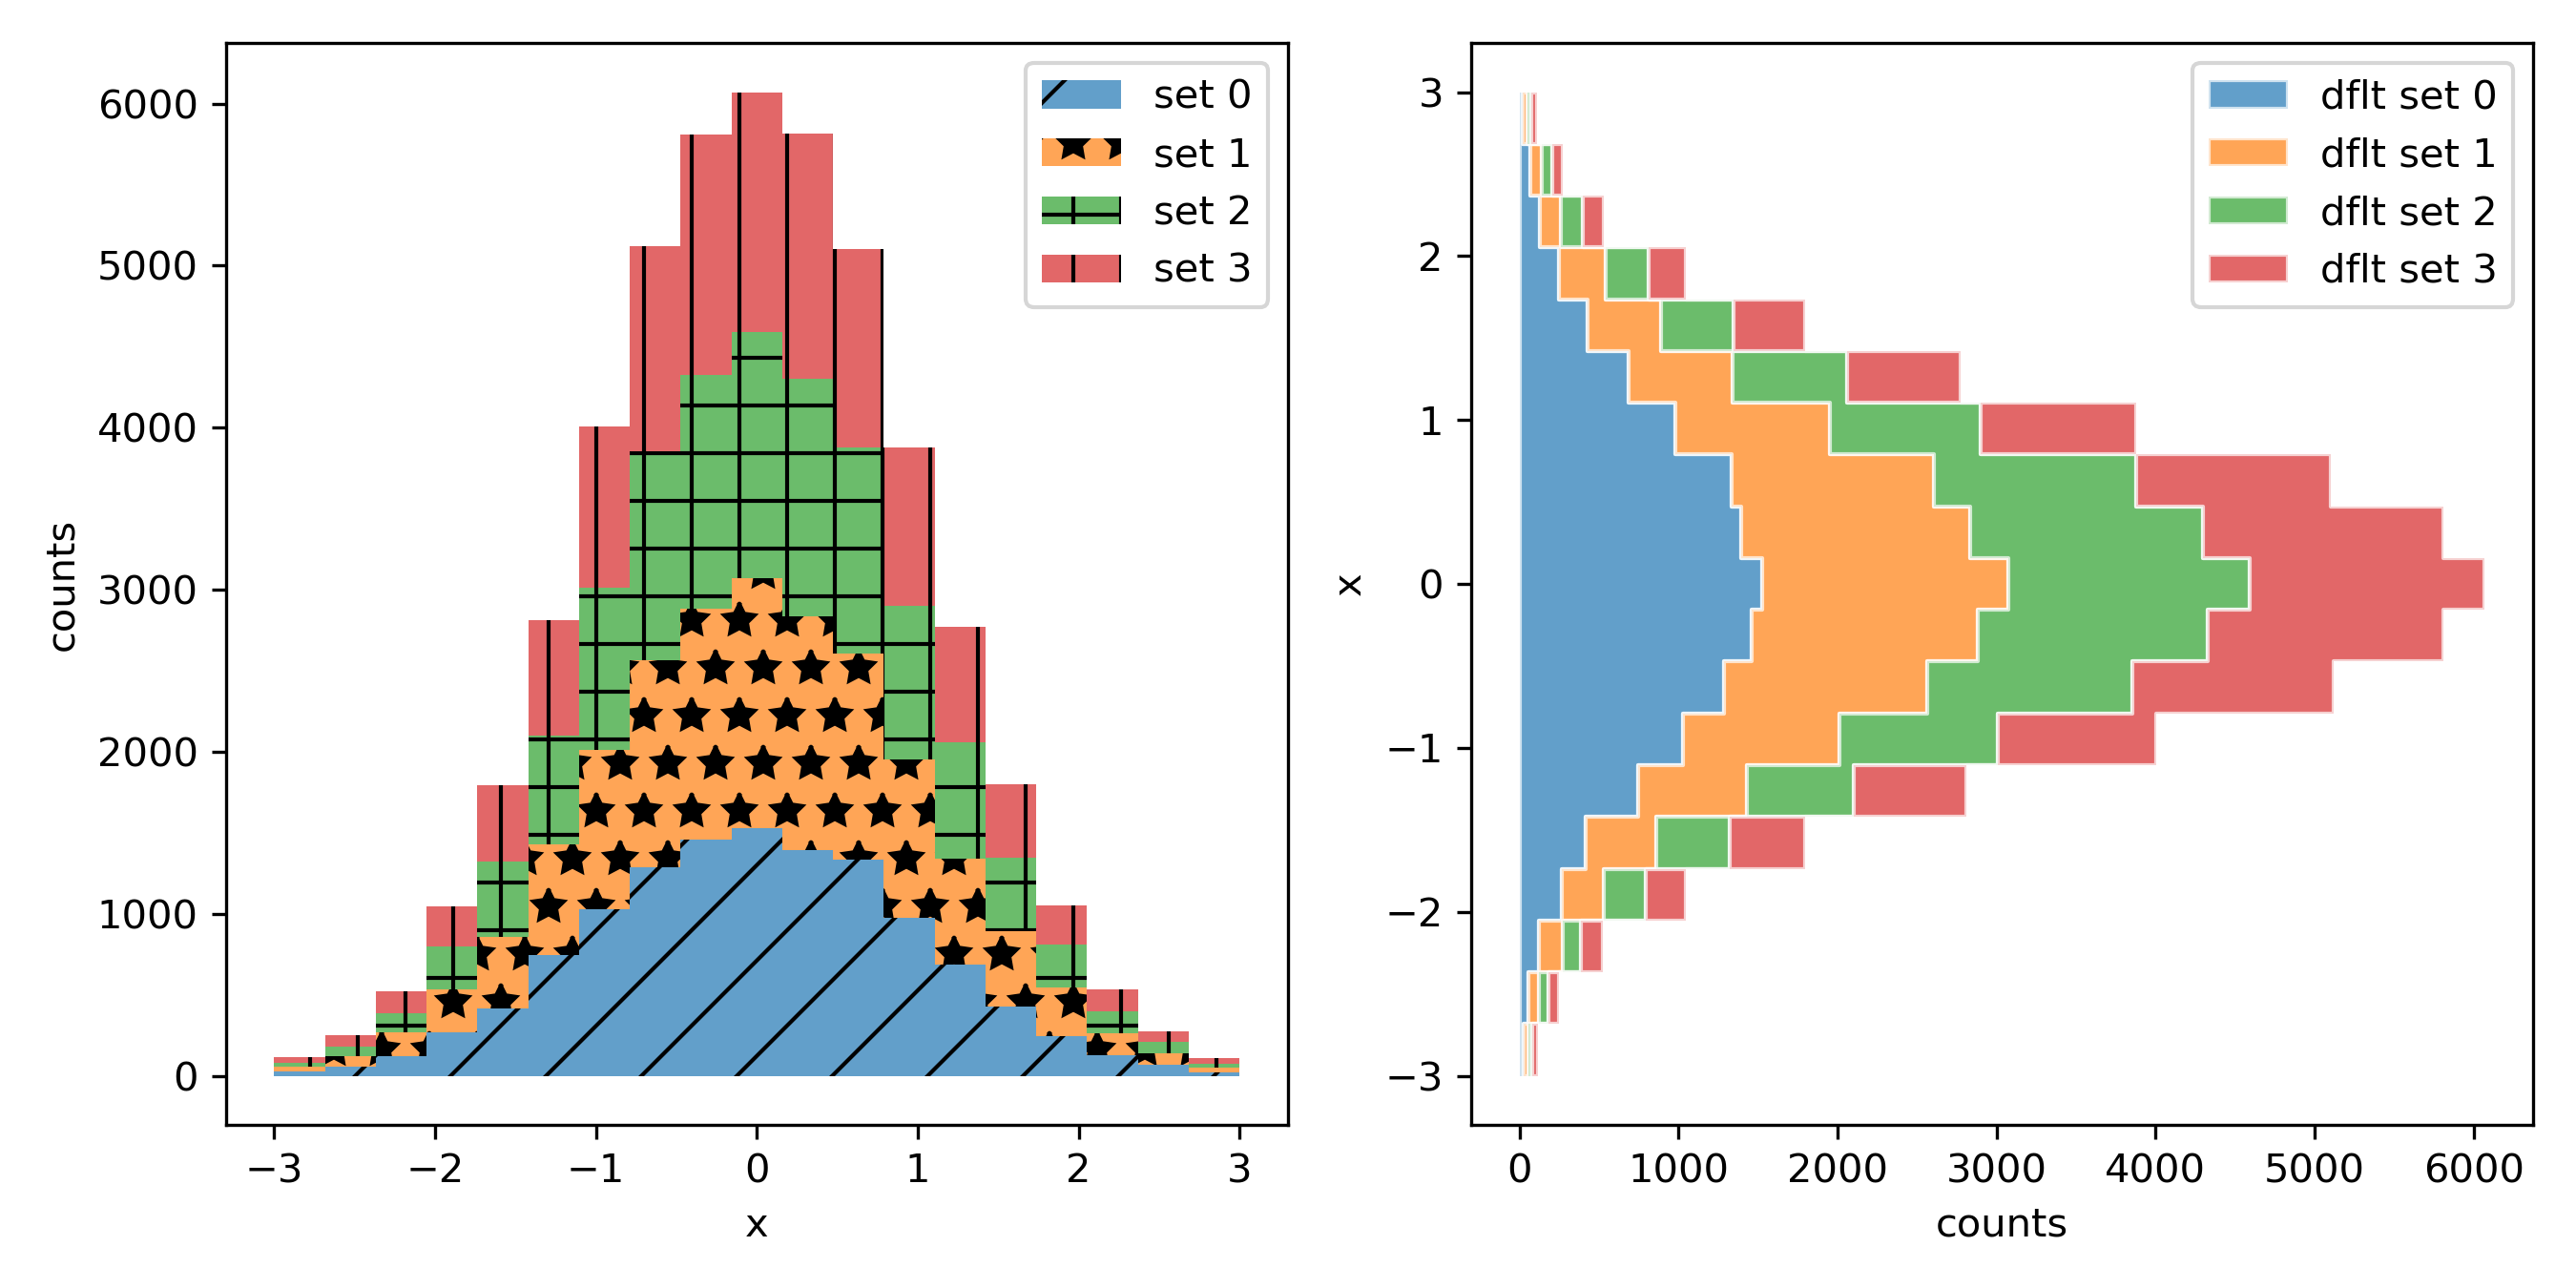
... ###############################################################################
... # Work with plain arrays
...
... fig, (ax1, ax2) = plt.subplots(1, 2, figsize=(9, 4.5), tight_layout=True)
... arts = stack_hist(ax1, stack_data, color_cycle + label_cycle + hatch_cycle,
... hist_func=hist_func)
...
... arts = stack_hist(ax2, stack_data, color_cycle,
... hist_func=hist_func,
... plot_kwargs=dict(edgecolor='w', orientation='h'))
... ax1.set_ylabel('counts')
... ax1.set_xlabel('x')
... ax2.set_xlabel('counts')
... ax2.set_ylabel('x')
...
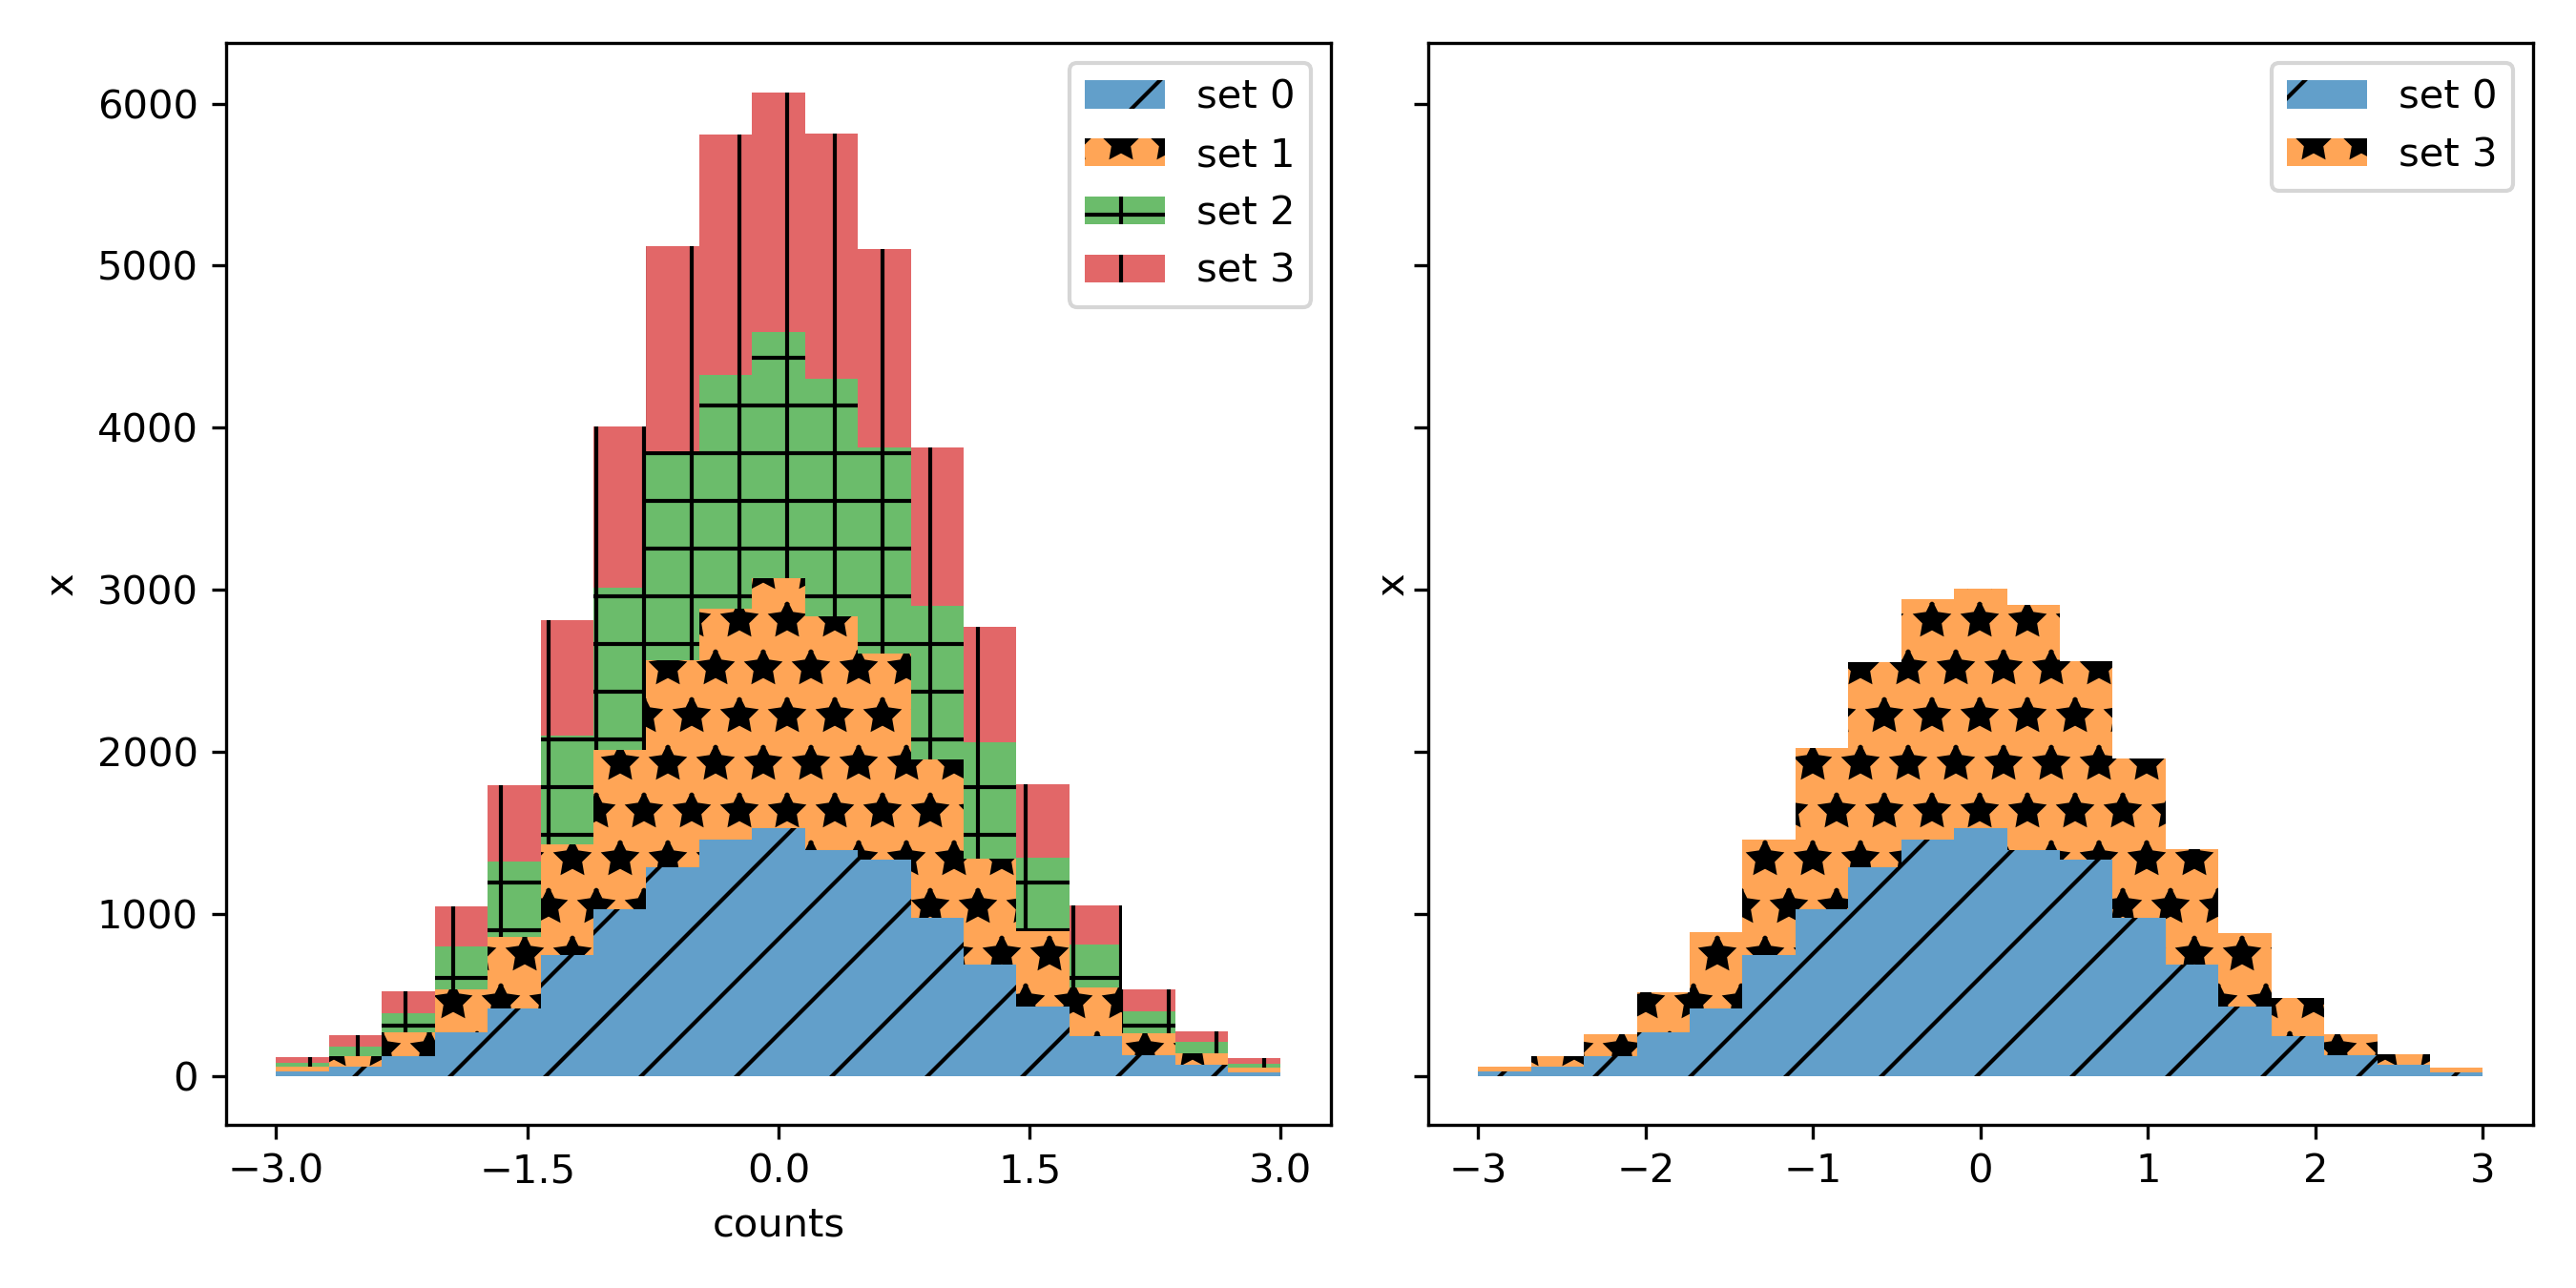
... ###############################################################################
... # Work with labeled data
...
... fig, (ax1, ax2) = plt.subplots(1, 2, figsize=(9, 4.5),
... tight_layout=True, sharey=True)
...
... arts = stack_hist(ax1, dict_data, color_cycle + hatch_cycle,
... hist_func=hist_func)
...
... arts = stack_hist(ax2, dict_data, color_cycle + hatch_cycle,
... hist_func=hist_func, labels=['set 0', 'set 3'])
... ax1.xaxis.set_major_locator(mticker.MaxNLocator(5))
... ax1.set_xlabel('counts')
... ax1.set_ylabel('x')
... ax2.set_ylabel('x')
...
... plt.show()
...
... #############################################################################
... #
... # .. admonition:: References
... #
... # The use of the following functions, methods, classes and modules is shown
... # in this example:
... #
... # - `matplotlib.axes.Axes.fill_betweenx` / `matplotlib.pyplot.fill_betweenx`
... # - `matplotlib.axes.Axes.fill_between` / `matplotlib.pyplot.fill_between`
... # - `matplotlib.axis.Axis.set_major_locator`
...