>>> """
==============================
Filling the area between lines
==============================
This example shows how to use `~.axes.Axes.fill_between` to color the area
between two lines.
"""
...
... import matplotlib.pyplot as plt
... import numpy as np
...
... ###############################################################################
... #
... # Basic usage
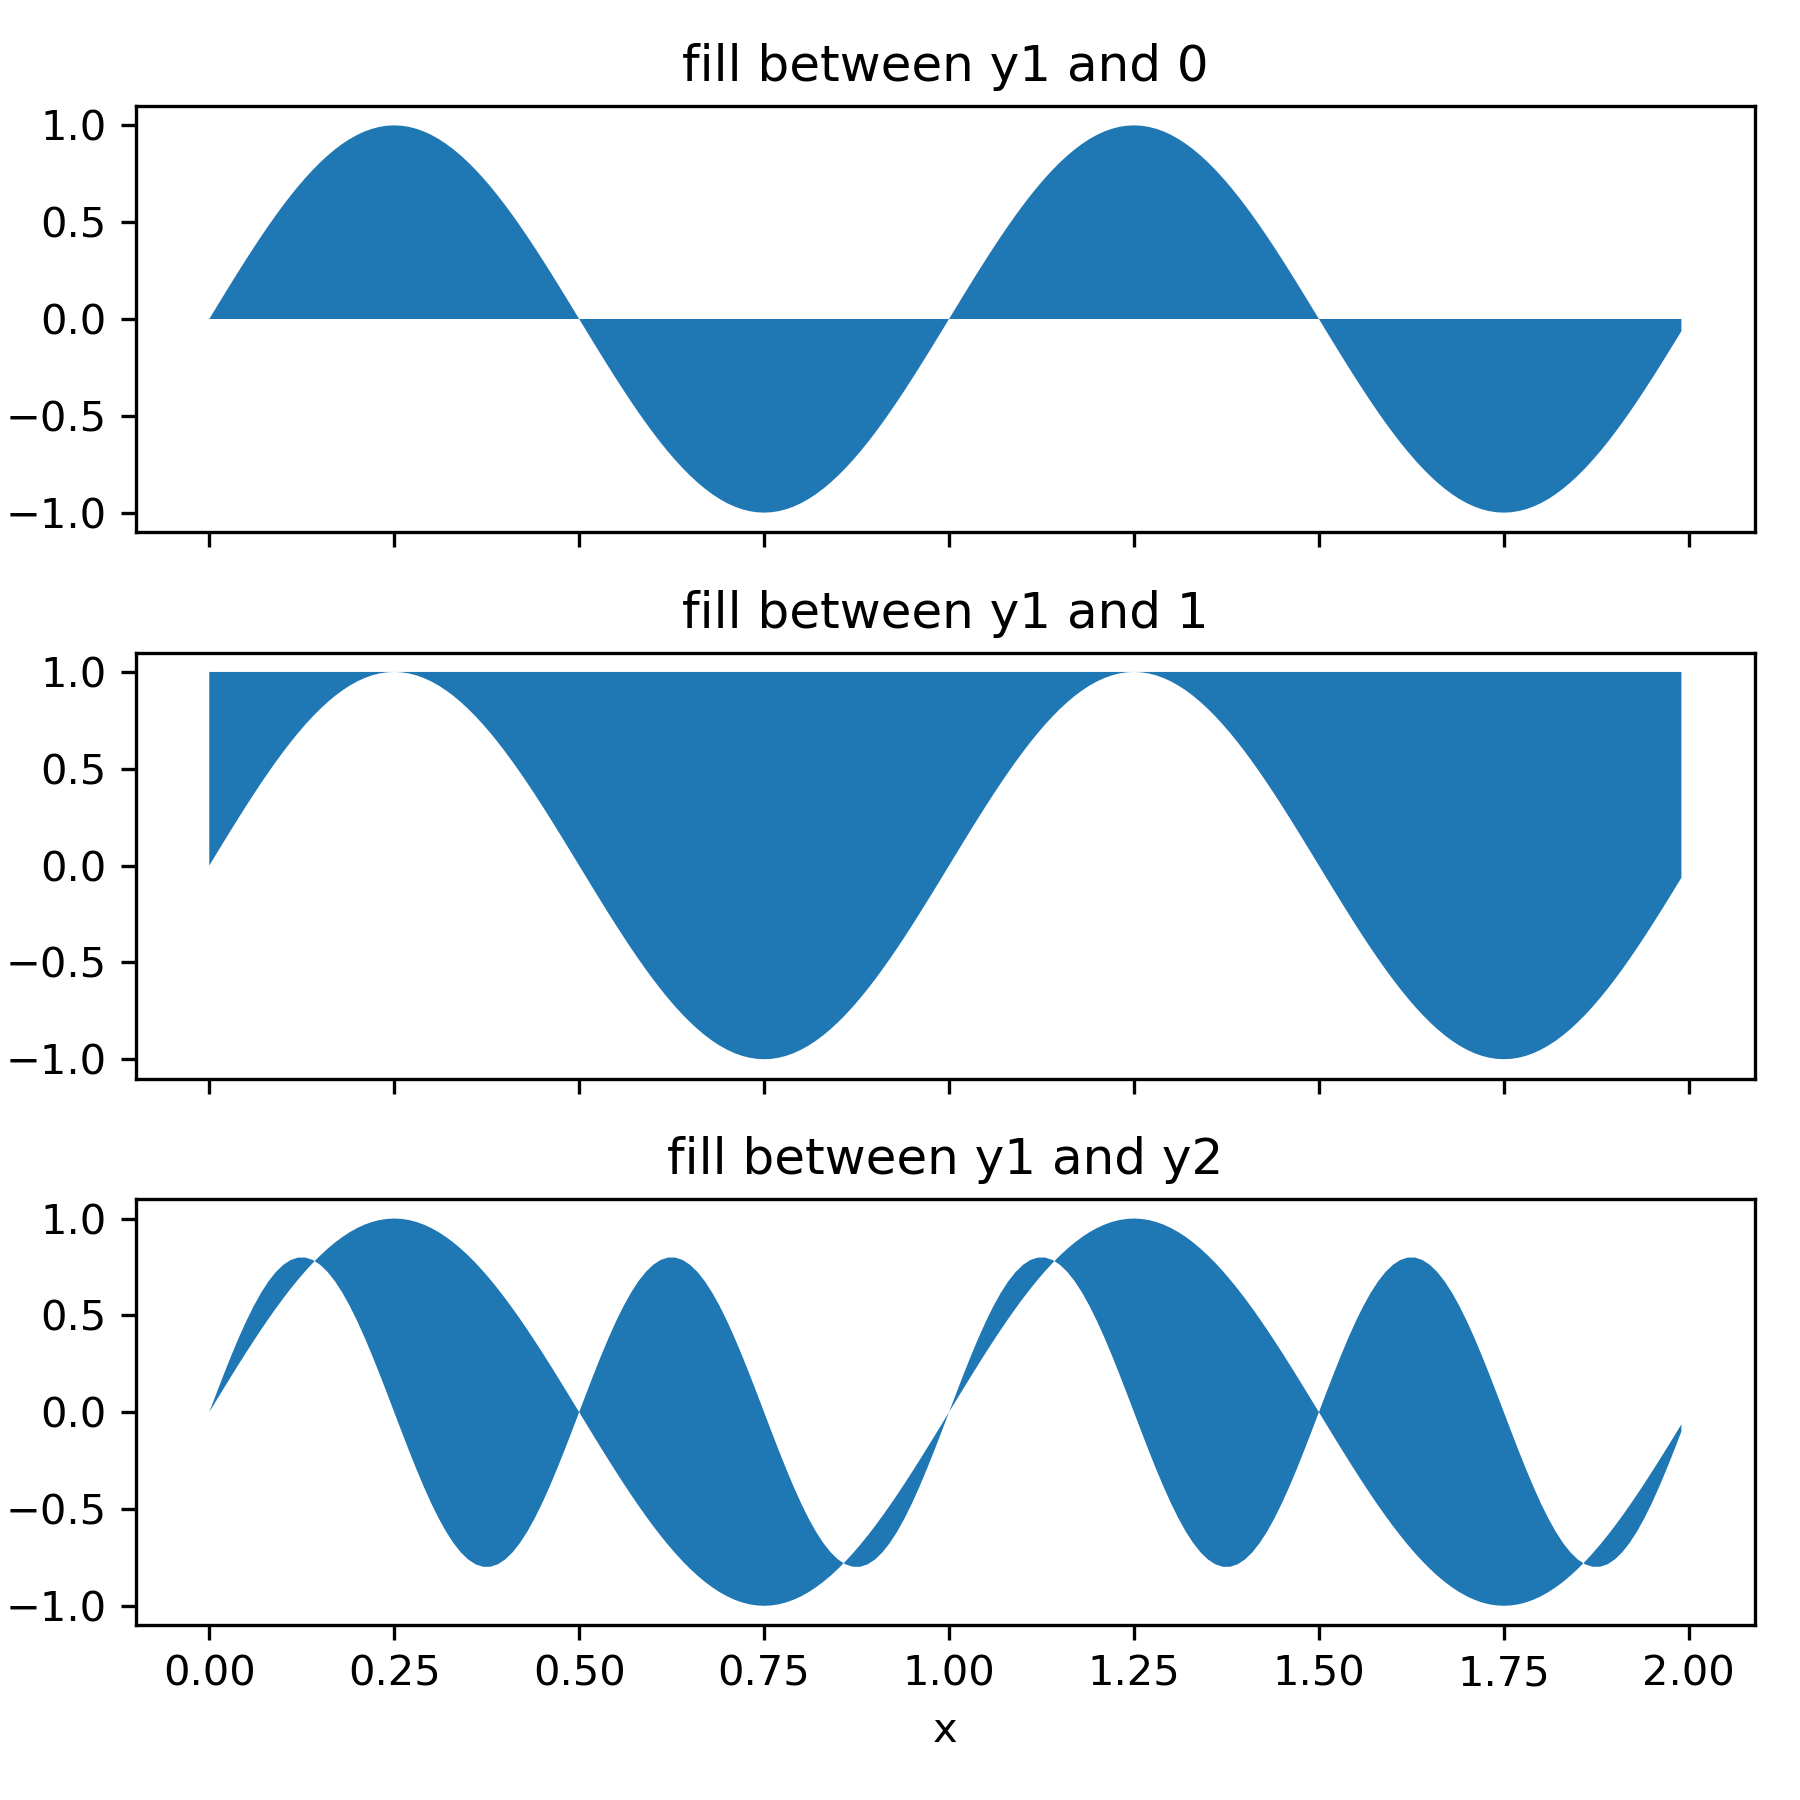
... # -----------
... # The parameters *y1* and *y2* can be scalars, indicating a horizontal
... # boundary at the given y-values. If only *y1* is given, *y2* defaults to 0.
...
... x = np.arange(0.0, 2, 0.01)
... y1 = np.sin(2 * np.pi * x)
... y2 = 0.8 * np.sin(4 * np.pi * x)
...
... fig, (ax1, ax2, ax3) = plt.subplots(3, 1, sharex=True, figsize=(6, 6))
...
... ax1.fill_between(x, y1)
... ax1.set_title('fill between y1 and 0')
...
... ax2.fill_between(x, y1, 1)
... ax2.set_title('fill between y1 and 1')
...
... ax3.fill_between(x, y1, y2)
... ax3.set_title('fill between y1 and y2')
... ax3.set_xlabel('x')
... fig.tight_layout()
...
... ###############################################################################
... #
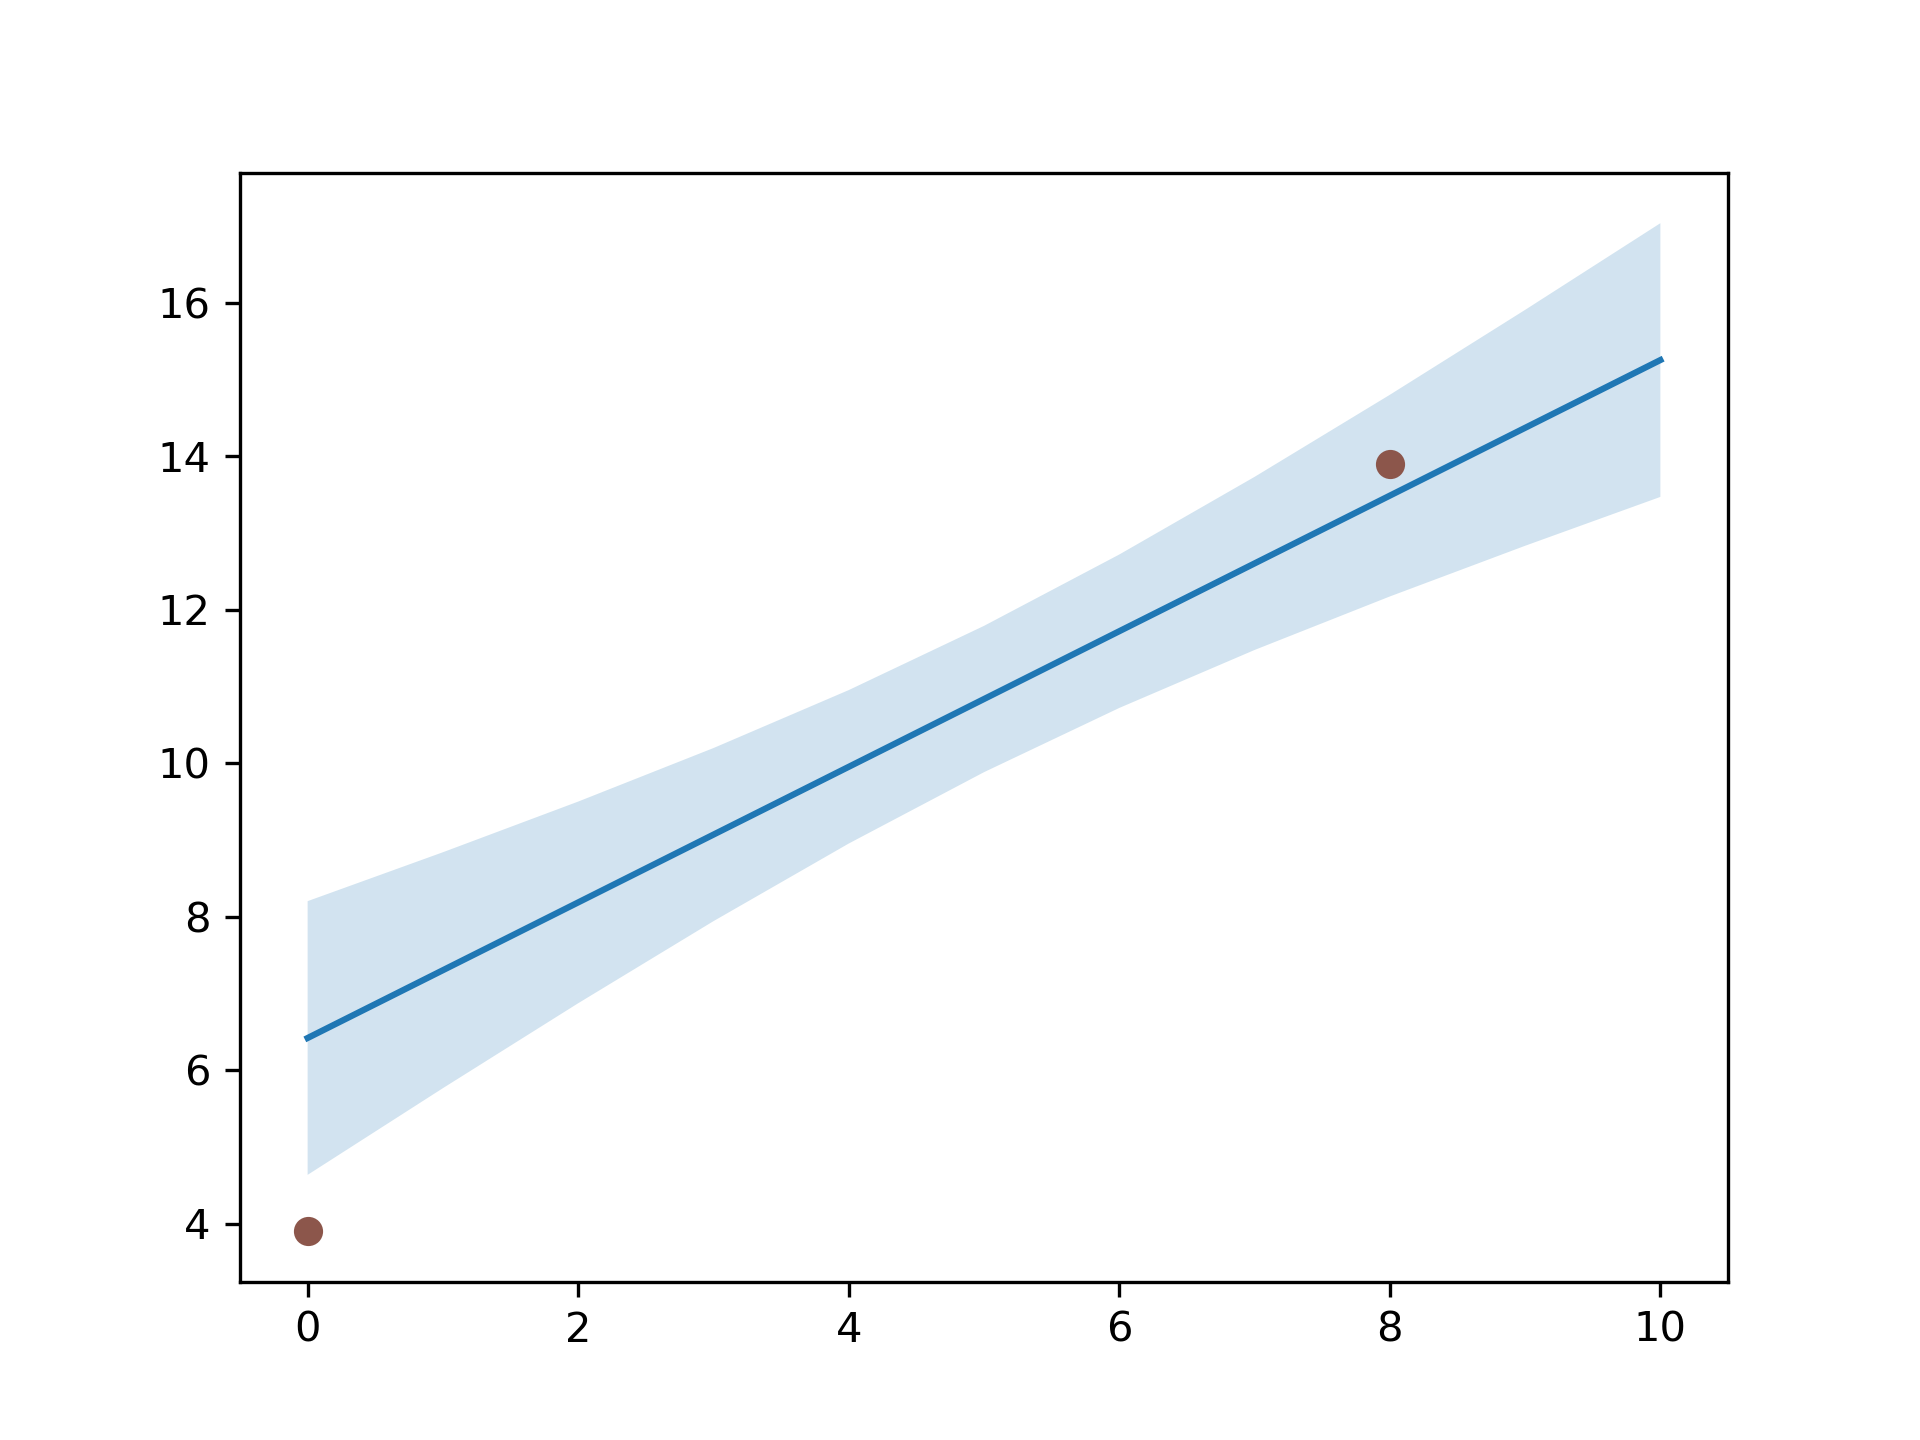
... # Example: Confidence bands
... # -------------------------
... # A common application for `~.axes.Axes.fill_between` is the indication of
... # confidence bands.
... #
... # `~.axes.Axes.fill_between` uses the colors of the color cycle as the fill
... # color. These may be a bit strong when applied to fill areas. It is
... # therefore often a good practice to lighten the color by making the area
... # semi-transparent using *alpha*.
...
... # sphinx_gallery_thumbnail_number = 2
...
... N = 21
... x = np.linspace(0, 10, 11)
... y = [3.9, 4.4, 10.8, 10.3, 11.2, 13.1, 14.1, 9.9, 13.9, 15.1, 12.5]
...
... # fit a linear curve an estimate its y-values and their error.
... a, b = np.polyfit(x, y, deg=1)
... y_est = a * x + b
... y_err = x.std() * np.sqrt(1/len(x) +
... (x - x.mean())**2 / np.sum((x - x.mean())**2))
...
... fig, ax = plt.subplots()
... ax.plot(x, y_est, '-')
... ax.fill_between(x, y_est - y_err, y_est + y_err, alpha=0.2)
... ax.plot(x, y, 'o', color='tab:brown')
...
... ###############################################################################
... #
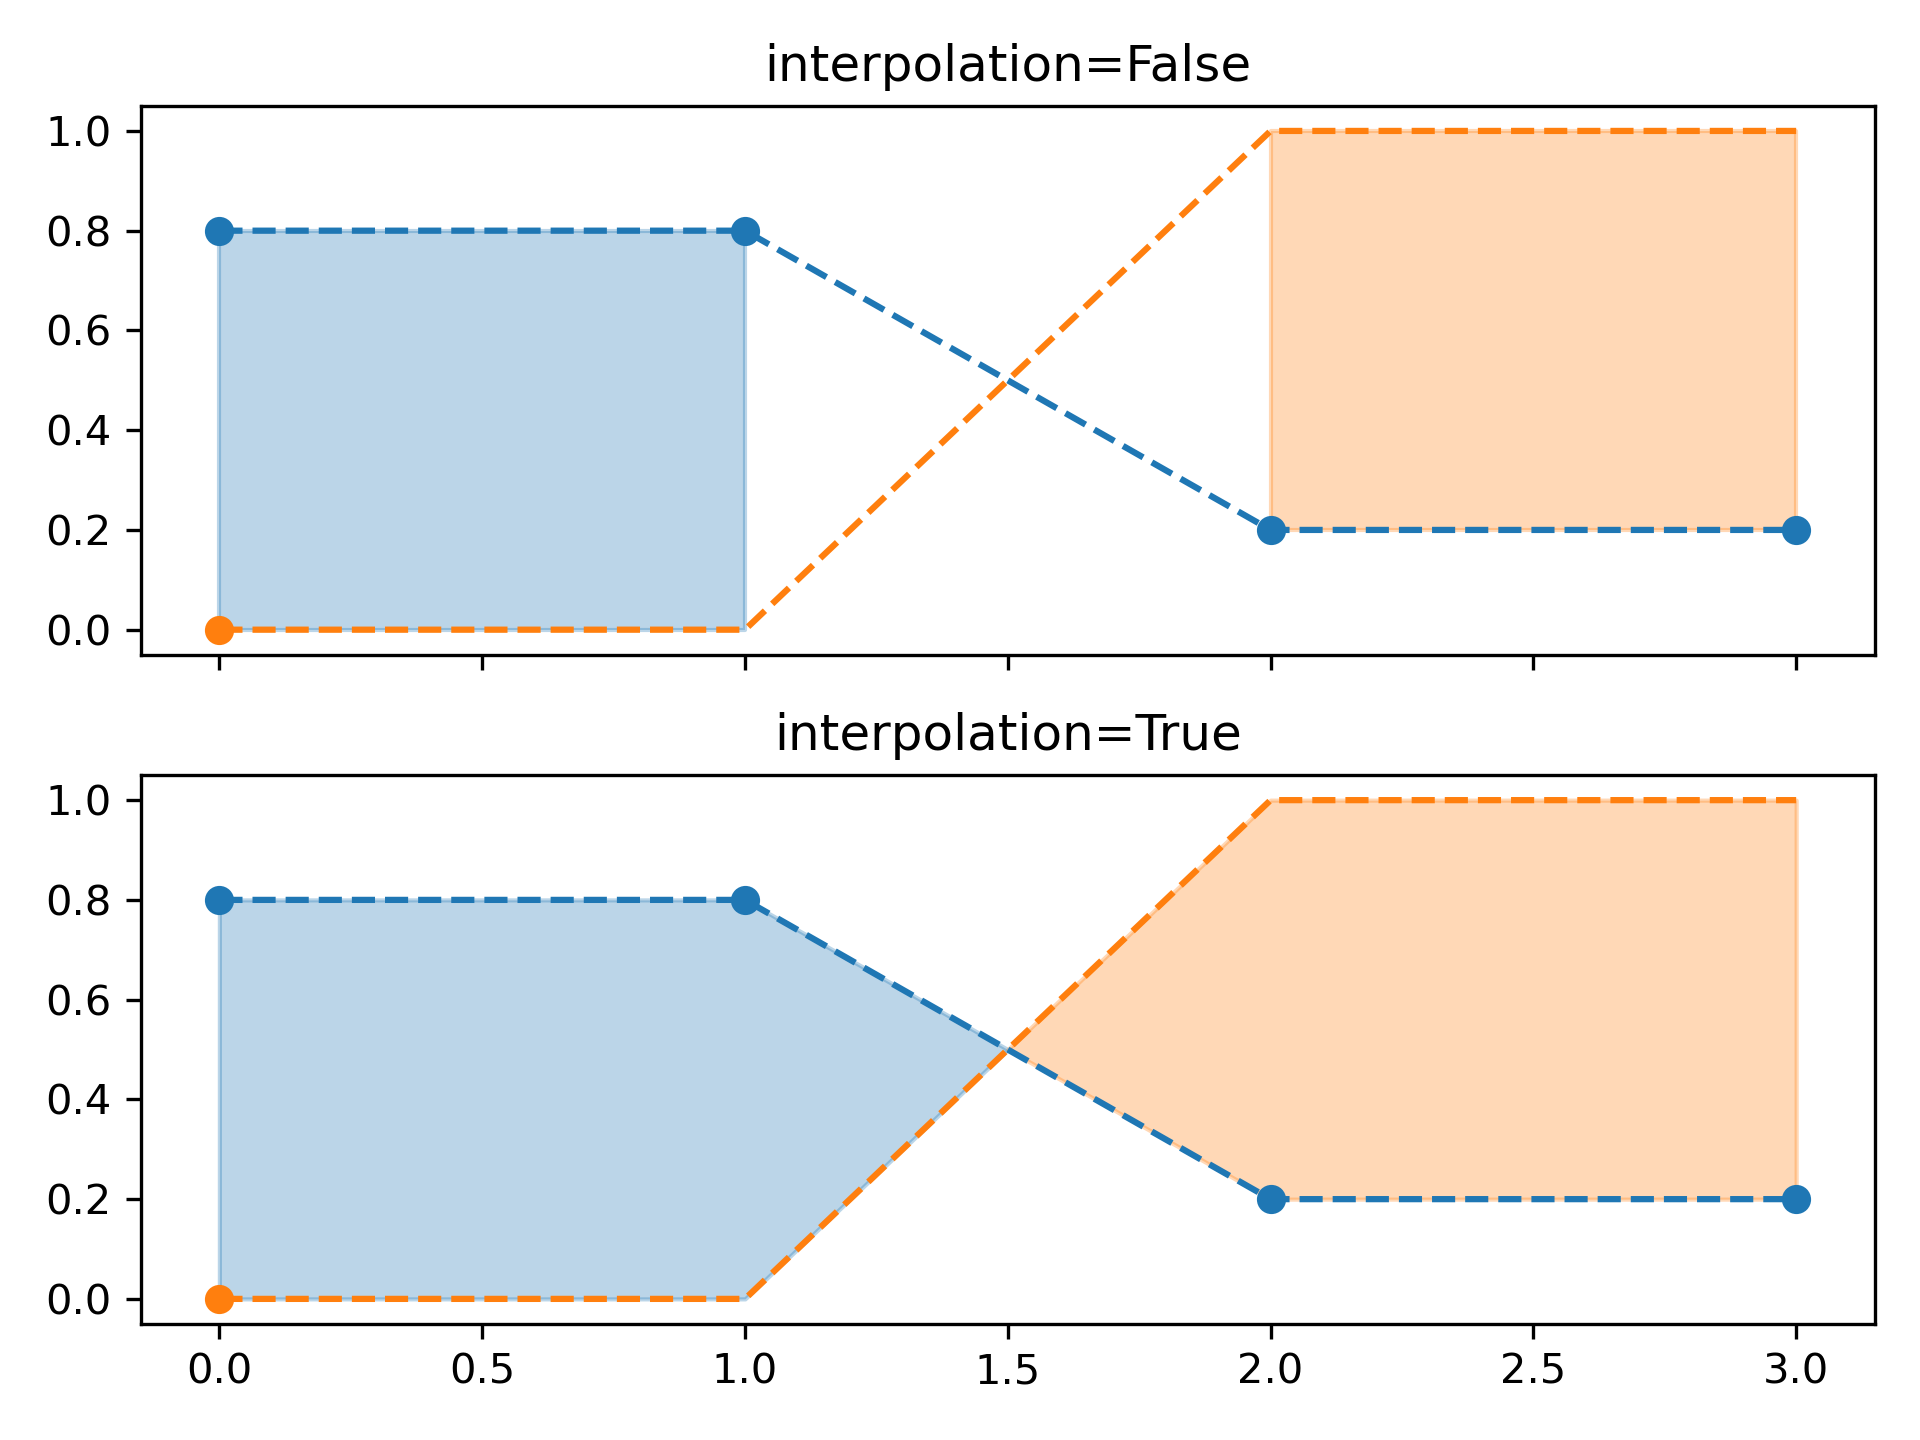
... # Selectively filling horizontal regions
... # --------------------------------------
... # The parameter *where* allows to specify the x-ranges to fill. It's a boolean
... # array with the same size as *x*.
... #
... # Only x-ranges of contiguous *True* sequences are filled. As a result the
... # range between neighboring *True* and *False* values is never filled. This
... # often undesired when the data points should represent a contiguous quantity.
... # It is therefore recommended to set ``interpolate=True`` unless the
... # x-distance of the data points is fine enough so that the above effect is not
... # noticeable. Interpolation approximates the actual x position at which the
... # *where* condition will change and extends the filling up to there.
...
... x = np.array([0, 1, 2, 3])
... y1 = np.array([0.8, 0.8, 0.2, 0.2])
... y2 = np.array([0, 0, 1, 1])
...
... fig, (ax1, ax2) = plt.subplots(2, 1, sharex=True)
...
... ax1.set_title('interpolation=False')
... ax1.plot(x, y1, 'o--')
... ax1.plot(x, y2, 'o--')
... ax1.fill_between(x, y1, y2, where=(y1 > y2), color='C0', alpha=0.3)
... ax1.fill_between(x, y1, y2, where=(y1 < y2), color='C1', alpha=0.3)
...
... ax2.set_title('interpolation=True')
... ax2.plot(x, y1, 'o--')
... ax2.plot(x, y2, 'o--')
... ax2.fill_between(x, y1, y2, where=(y1 > y2), color='C0', alpha=0.3,
... interpolate=True)
... ax2.fill_between(x, y1, y2, where=(y1 <= y2), color='C1', alpha=0.3,
... interpolate=True)
... fig.tight_layout()
...
... ###############################################################################
... #
... # .. note::
... #
... # Similar gaps will occur if *y1* or *y2* are masked arrays. Since missing
... # values cannot be approximated, *interpolate* has no effect in this case.
... # The gaps around masked values can only be reduced by adding more data
... # points close to the masked values.
...
... ###############################################################################
... #
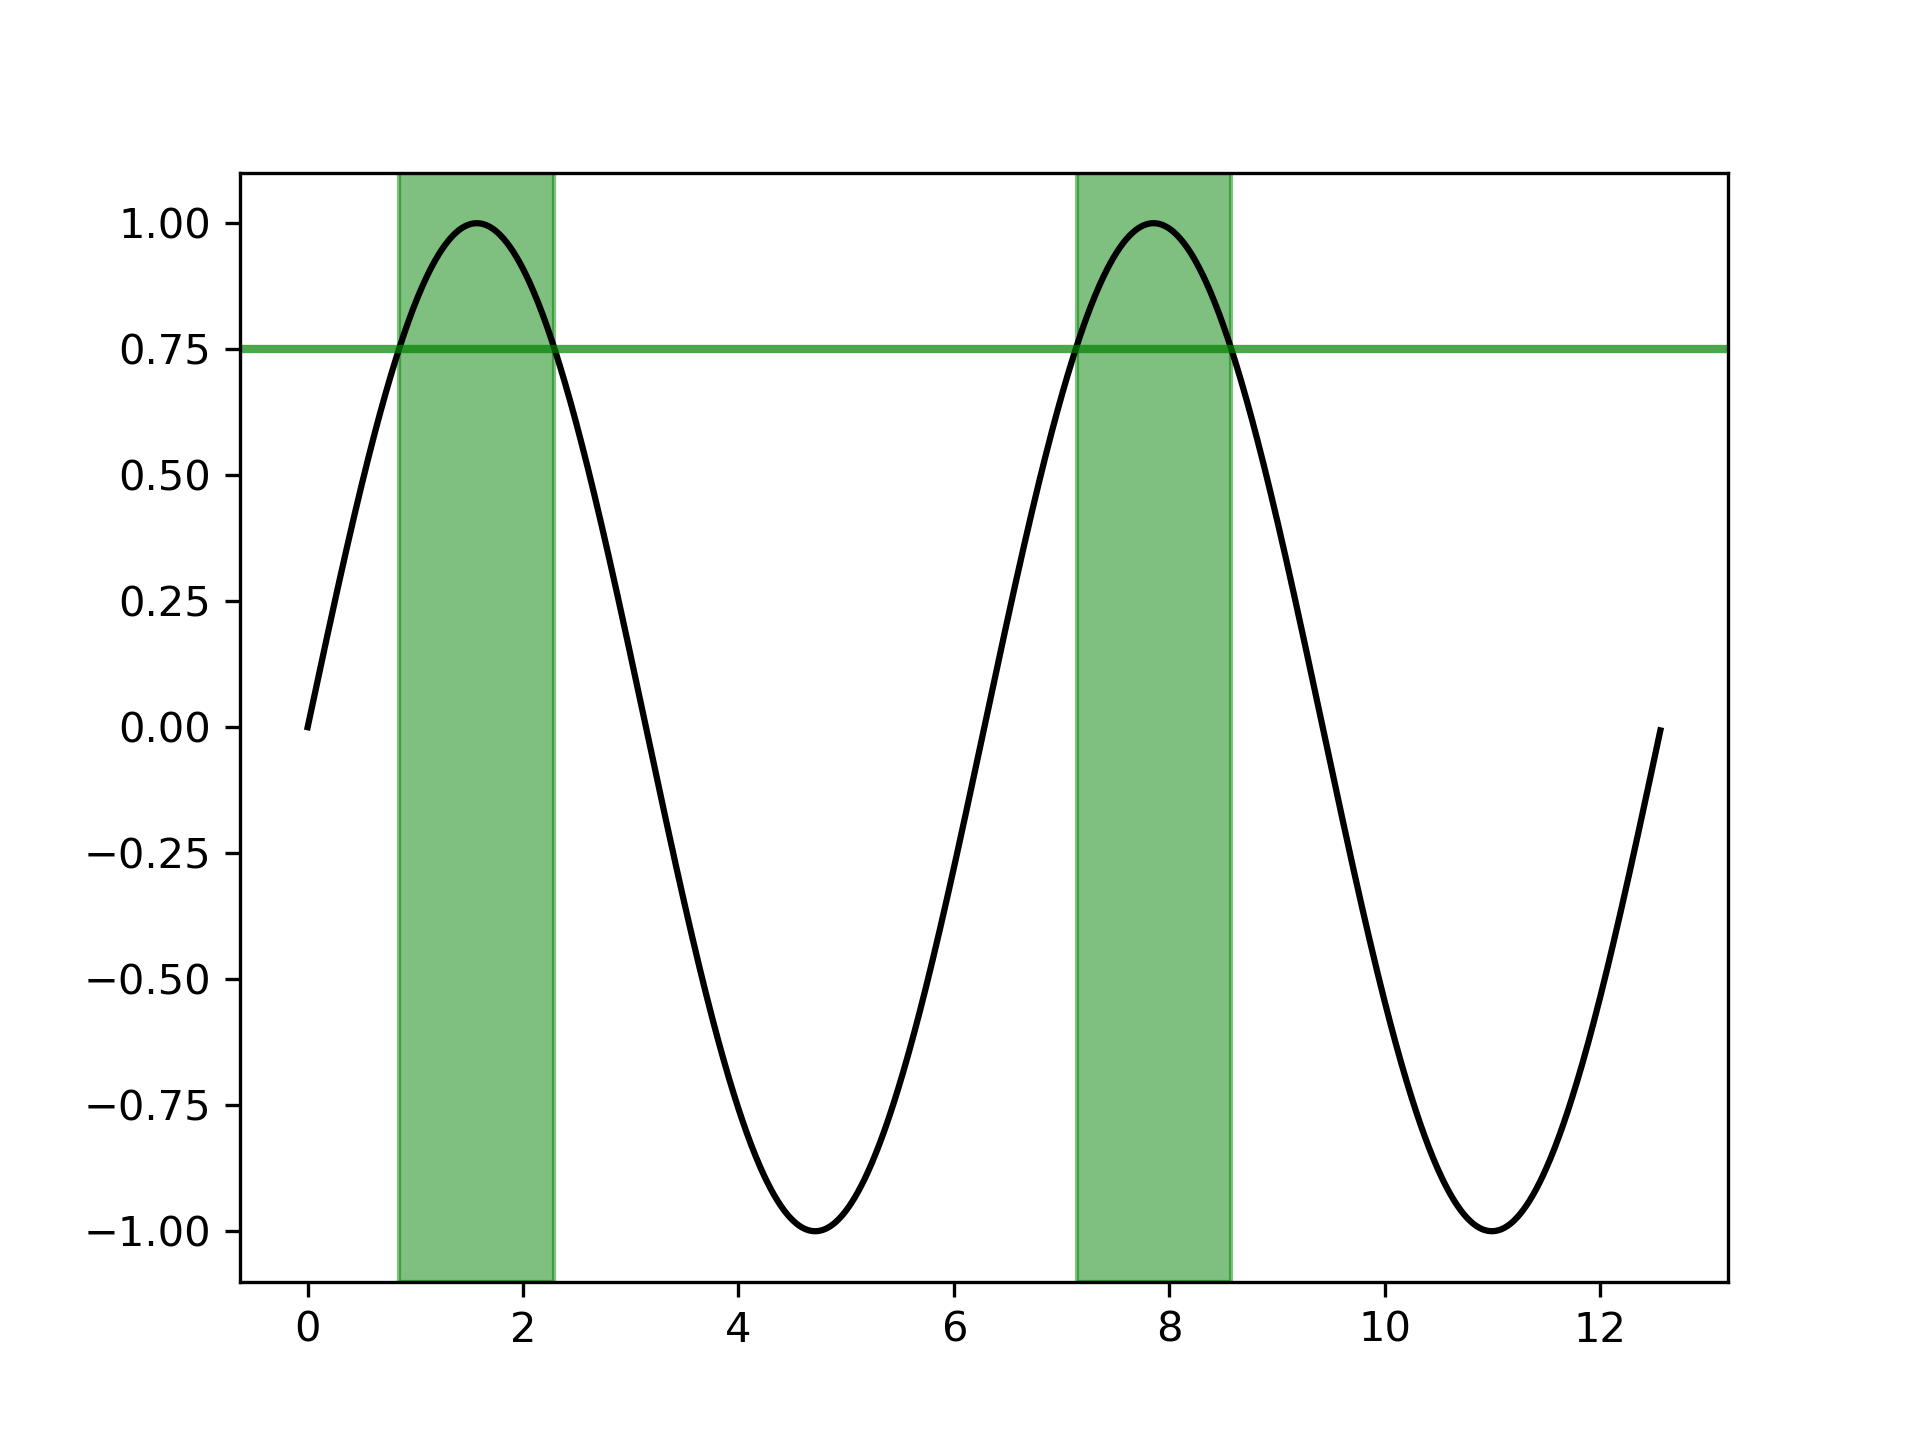
... # Selectively marking horizontal regions across the whole Axes
... # ------------------------------------------------------------
... # The same selection mechanism can be applied to fill the full vertical height
... # of the axes. To be independent of y-limits, we add a transform that
... # interprets the x-values in data coorindates and the y-values in axes
... # coordinates.
... #
... # The following example marks the regions in which the y-data are above a
... # given threshold.
...
... fig, ax = plt.subplots()
... x = np.arange(0, 4 * np.pi, 0.01)
... y = np.sin(x)
... ax.plot(x, y, color='black')
...
... threshold = 0.75
... ax.axhline(threshold, color='green', lw=2, alpha=0.7)
... ax.fill_between(x, 0, 1, where=y > threshold,
... color='green', alpha=0.5, transform=ax.get_xaxis_transform())
...
... #############################################################################
... #
... # .. admonition:: References
... #
... # The use of the following functions, methods, classes and modules is shown
... # in this example:
... #
... # - `matplotlib.axes.Axes.fill_between` / `matplotlib.pyplot.fill_between`
... # - `matplotlib.axes.Axes.get_xaxis_transform`
...