>>> """
=============================================
Figure labels: suptitle, supxlabel, supylabel
=============================================
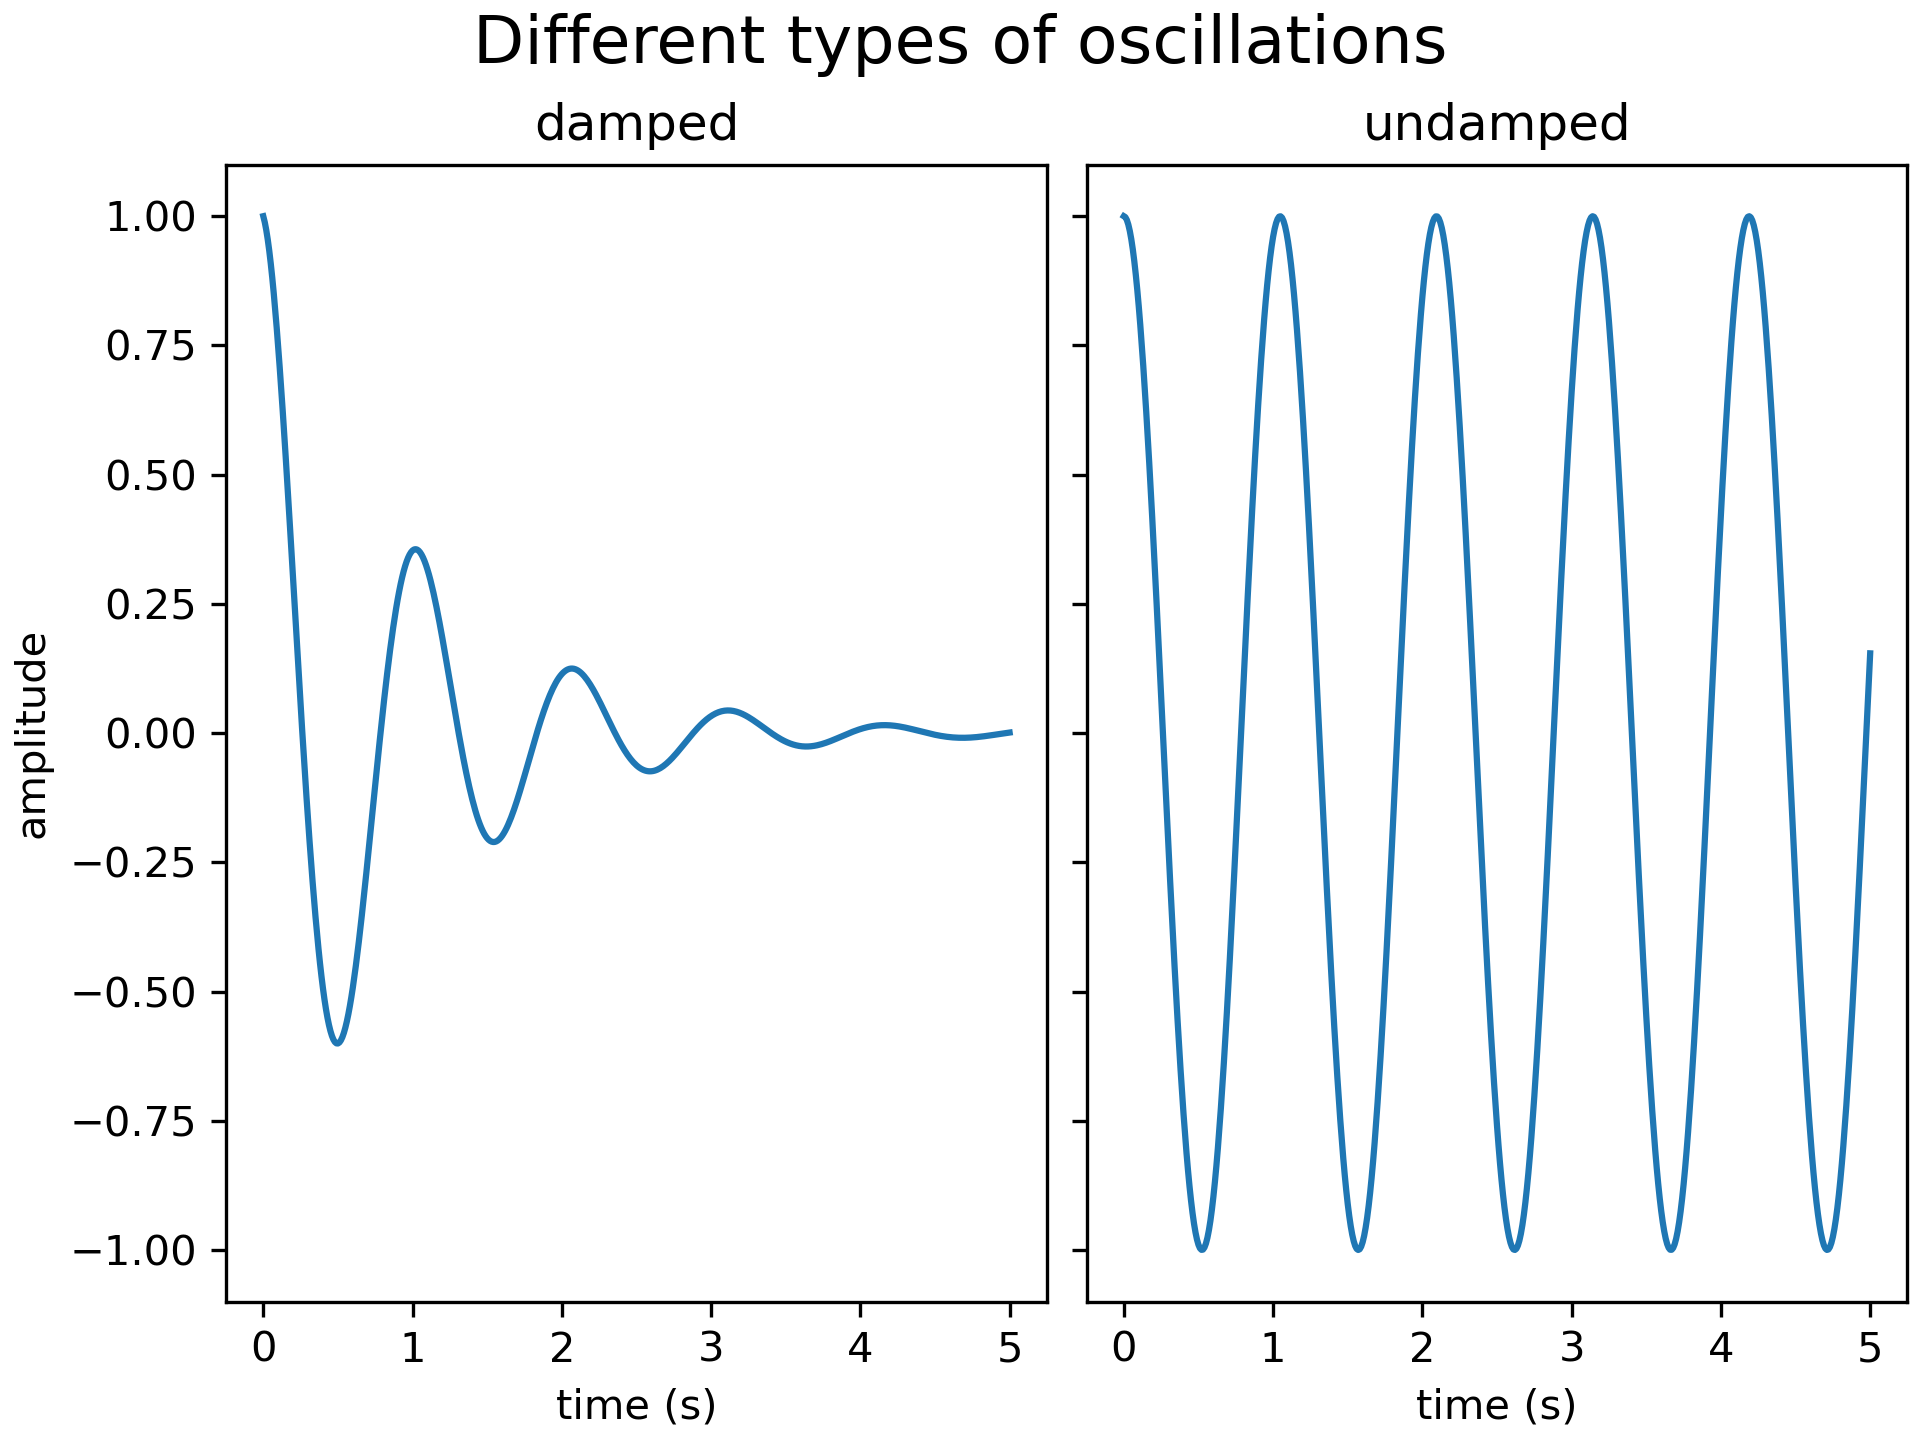
Each axes can have a title (or actually three - one each with *loc* "left",
"center", and "right"), but is sometimes desirable to give a whole figure
(or `.SubFigure`) an overall title, using `.FigureBase.suptitle`.
We can also add figure-level x- and y-labels using `.FigureBase.supxlabel` and
`.FigureBase.supylabel`.
"""
... from matplotlib.cbook import get_sample_data
... import matplotlib.pyplot as plt
...
... import numpy as np
...
...
... x = np.linspace(0.0, 5.0, 501)
...
... fig, (ax1, ax2) = plt.subplots(1, 2, constrained_layout=True, sharey=True)
... ax1.plot(x, np.cos(6*x) * np.exp(-x))
... ax1.set_title('damped')
... ax1.set_xlabel('time (s)')
... ax1.set_ylabel('amplitude')
...
... ax2.plot(x, np.cos(6*x))
... ax2.set_xlabel('time (s)')
... ax2.set_title('undamped')
...
... fig.suptitle('Different types of oscillations', fontsize=16)
...
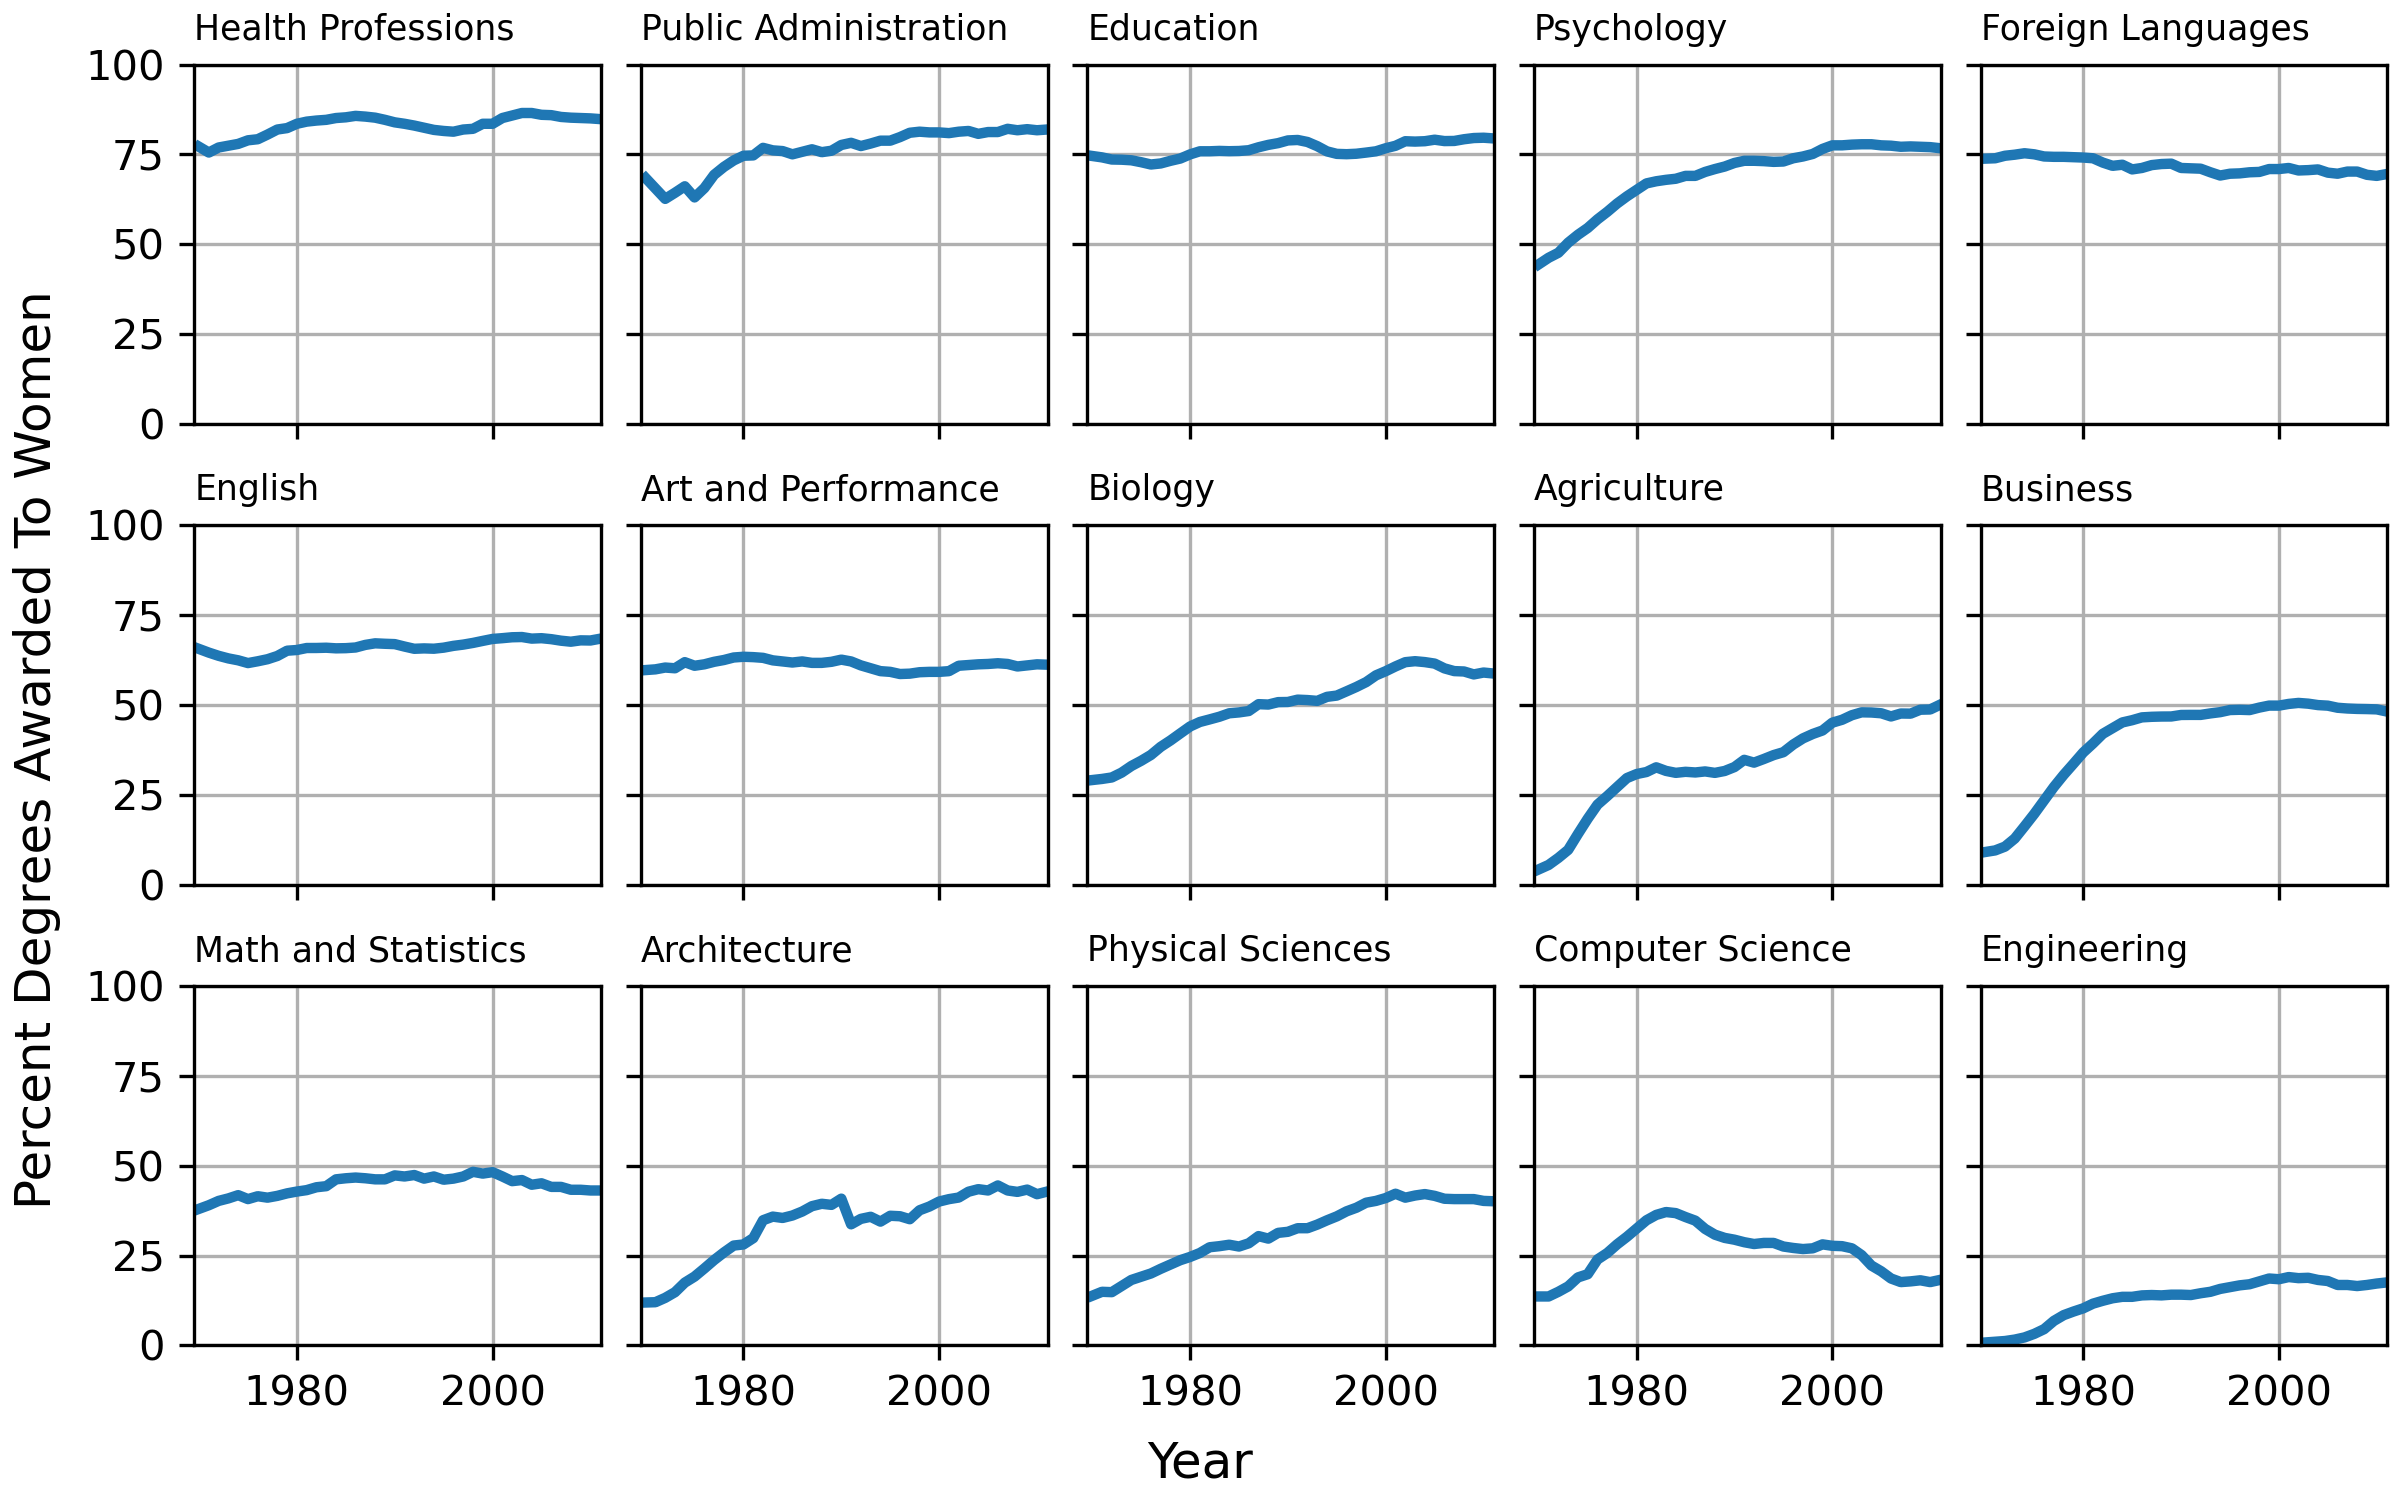
... ##############################################################################
... # A global x- or y-label can be set using the `.FigureBase.supxlabel` and
... # `.FigureBase.supylabel` methods.
...
... fig, axs = plt.subplots(3, 5, figsize=(8, 5), constrained_layout=True,
... sharex=True, sharey=True)
...
... fname = get_sample_data('percent_bachelors_degrees_women_usa.csv',
... asfileobj=False)
... gender_degree_data = np.genfromtxt(fname, delimiter=',', names=True)
...
... majors = ['Health Professions', 'Public Administration', 'Education',
... 'Psychology', 'Foreign Languages', 'English',
... 'Art and Performance', 'Biology',
... 'Agriculture', 'Business',
... 'Math and Statistics', 'Architecture', 'Physical Sciences',
... 'Computer Science', 'Engineering']
...
... for nn, ax in enumerate(axs.flat):
... ax.set_xlim(1969.5, 2011.1)
... column = majors[nn]
... column_rec_name = column.replace('\n', '_').replace(' ', '_')
...
... line, = ax.plot('Year', column_rec_name, data=gender_degree_data,
... lw=2.5)
... ax.set_title(column, fontsize='small', loc='left')
... ax.set_ylim([0, 100])
... ax.grid()
... fig.supxlabel('Year')
... fig.supylabel('Percent Degrees Awarded To Women')
...
... plt.show()
...