>>> """
=========================
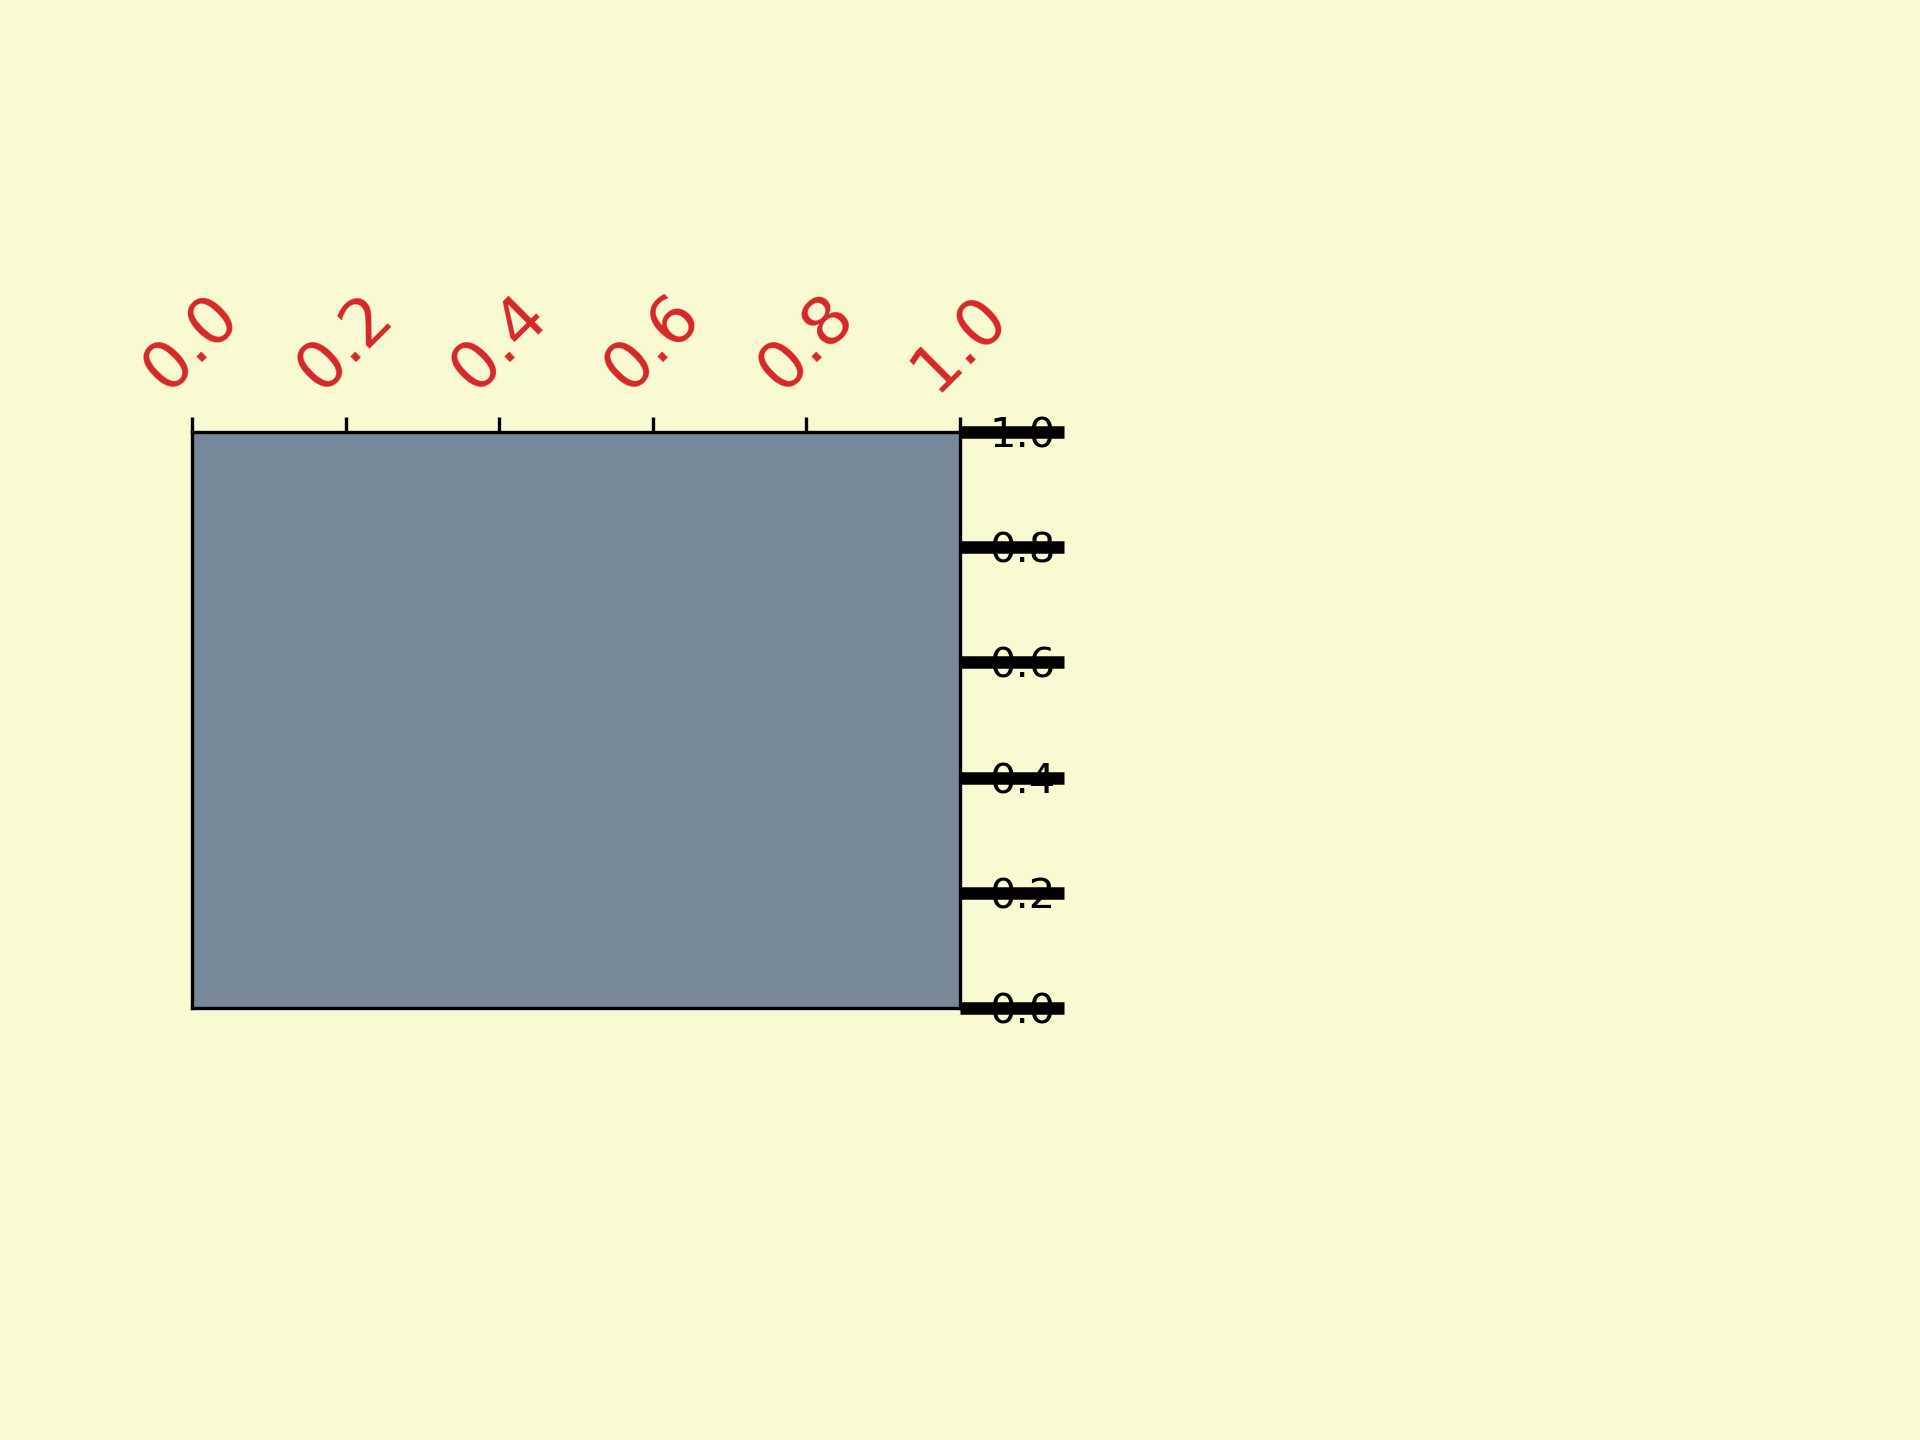
Fig Axes Customize Simple
=========================
Customize the background, labels and ticks of a simple plot.
"""
...
... import matplotlib.pyplot as plt
...
... ###############################################################################
... # `.pyplot.figure` creates a `matplotlib.figure.Figure` instance.
...
... fig = plt.figure()
... rect = fig.patch # a rectangle instance
... rect.set_facecolor('lightgoldenrodyellow')
...
... ax1 = fig.add_axes([0.1, 0.3, 0.4, 0.4])
... rect = ax1.patch
... rect.set_facecolor('lightslategray')
...
...
... for label in ax1.xaxis.get_ticklabels():
... # label is a Text instance
... label.set_color('tab:red')
... label.set_rotation(45)
... label.set_fontsize(16)
...
... for line in ax1.yaxis.get_ticklines():
... # line is a Line2D instance
... line.set_color('tab:green')
... line.set_markersize(25)
... line.set_markeredgewidth(3)
...
... plt.show()
...
... #############################################################################
... #
... # .. admonition:: References
... #
... # The use of the following functions, methods, classes and modules is shown
... # in this example:
... #
... # - `matplotlib.axis.Axis.get_ticklabels`
... # - `matplotlib.axis.Axis.get_ticklines`
... # - `matplotlib.text.Text.set_rotation`
... # - `matplotlib.text.Text.set_fontsize`
... # - `matplotlib.text.Text.set_color`
... # - `matplotlib.lines.Line2D`
... # - `matplotlib.lines.Line2D.set_color`
... # - `matplotlib.lines.Line2D.set_markersize`
... # - `matplotlib.lines.Line2D.set_markeredgewidth`
... # - `matplotlib.patches.Patch.set_facecolor`
...