>>> """
====================
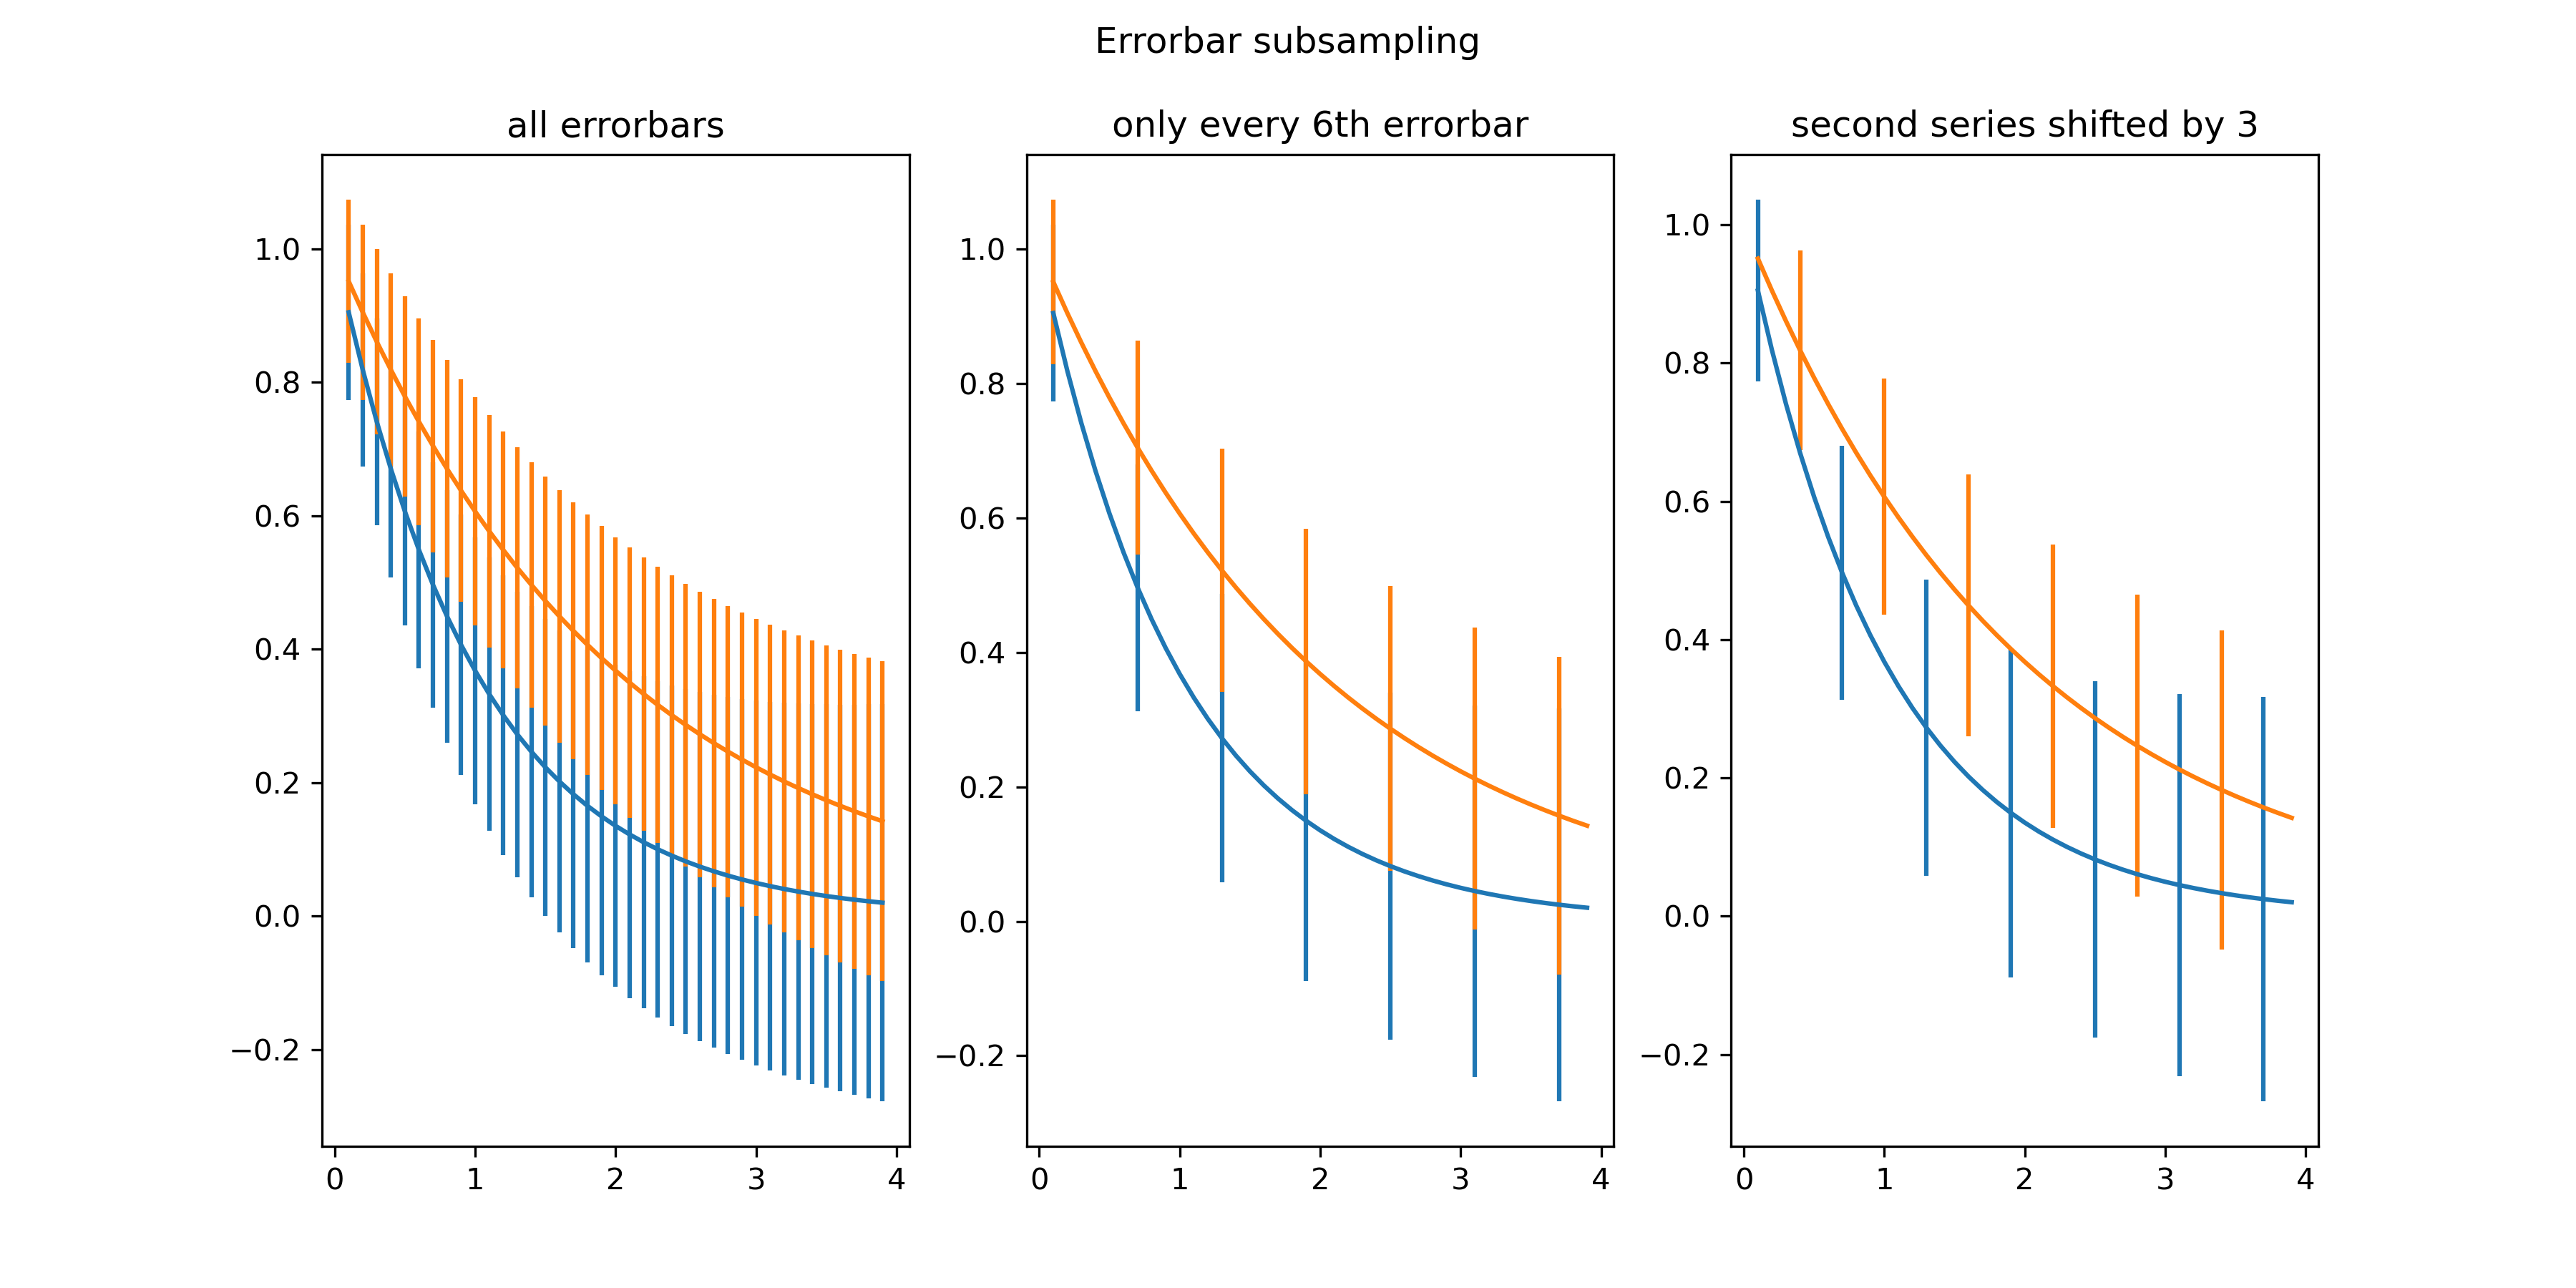
Errorbar subsampling
====================
The parameter *errorevery* of `.Axes.errorbar` can be used to draw error bars
only on a subset of data points. This is particularly useful if there are many
data points with similar errors.
"""
...
... import numpy as np
... import matplotlib.pyplot as plt
...
... # example data
... x = np.arange(0.1, 4, 0.1)
... y1 = np.exp(-1.0 * x)
... y2 = np.exp(-0.5 * x)
...
... # example variable error bar values
... y1err = 0.1 + 0.1 * np.sqrt(x)
... y2err = 0.1 + 0.1 * np.sqrt(x/2)
...
...
... fig, (ax0, ax1, ax2) = plt.subplots(nrows=1, ncols=3, sharex=True,
... figsize=(12, 6))
...
... ax0.set_title('all errorbars')
... ax0.errorbar(x, y1, yerr=y1err)
... ax0.errorbar(x, y2, yerr=y2err)
...
... ax1.set_title('only every 6th errorbar')
... ax1.errorbar(x, y1, yerr=y1err, errorevery=6)
... ax1.errorbar(x, y2, yerr=y2err, errorevery=6)
...
... ax2.set_title('second series shifted by 3')
... ax2.errorbar(x, y1, yerr=y1err, errorevery=(0, 6))
... ax2.errorbar(x, y2, yerr=y2err, errorevery=(3, 6))
...
... fig.suptitle('Errorbar subsampling')
... plt.show()
...