>>> """
========================
Errorbar limit selection
========================
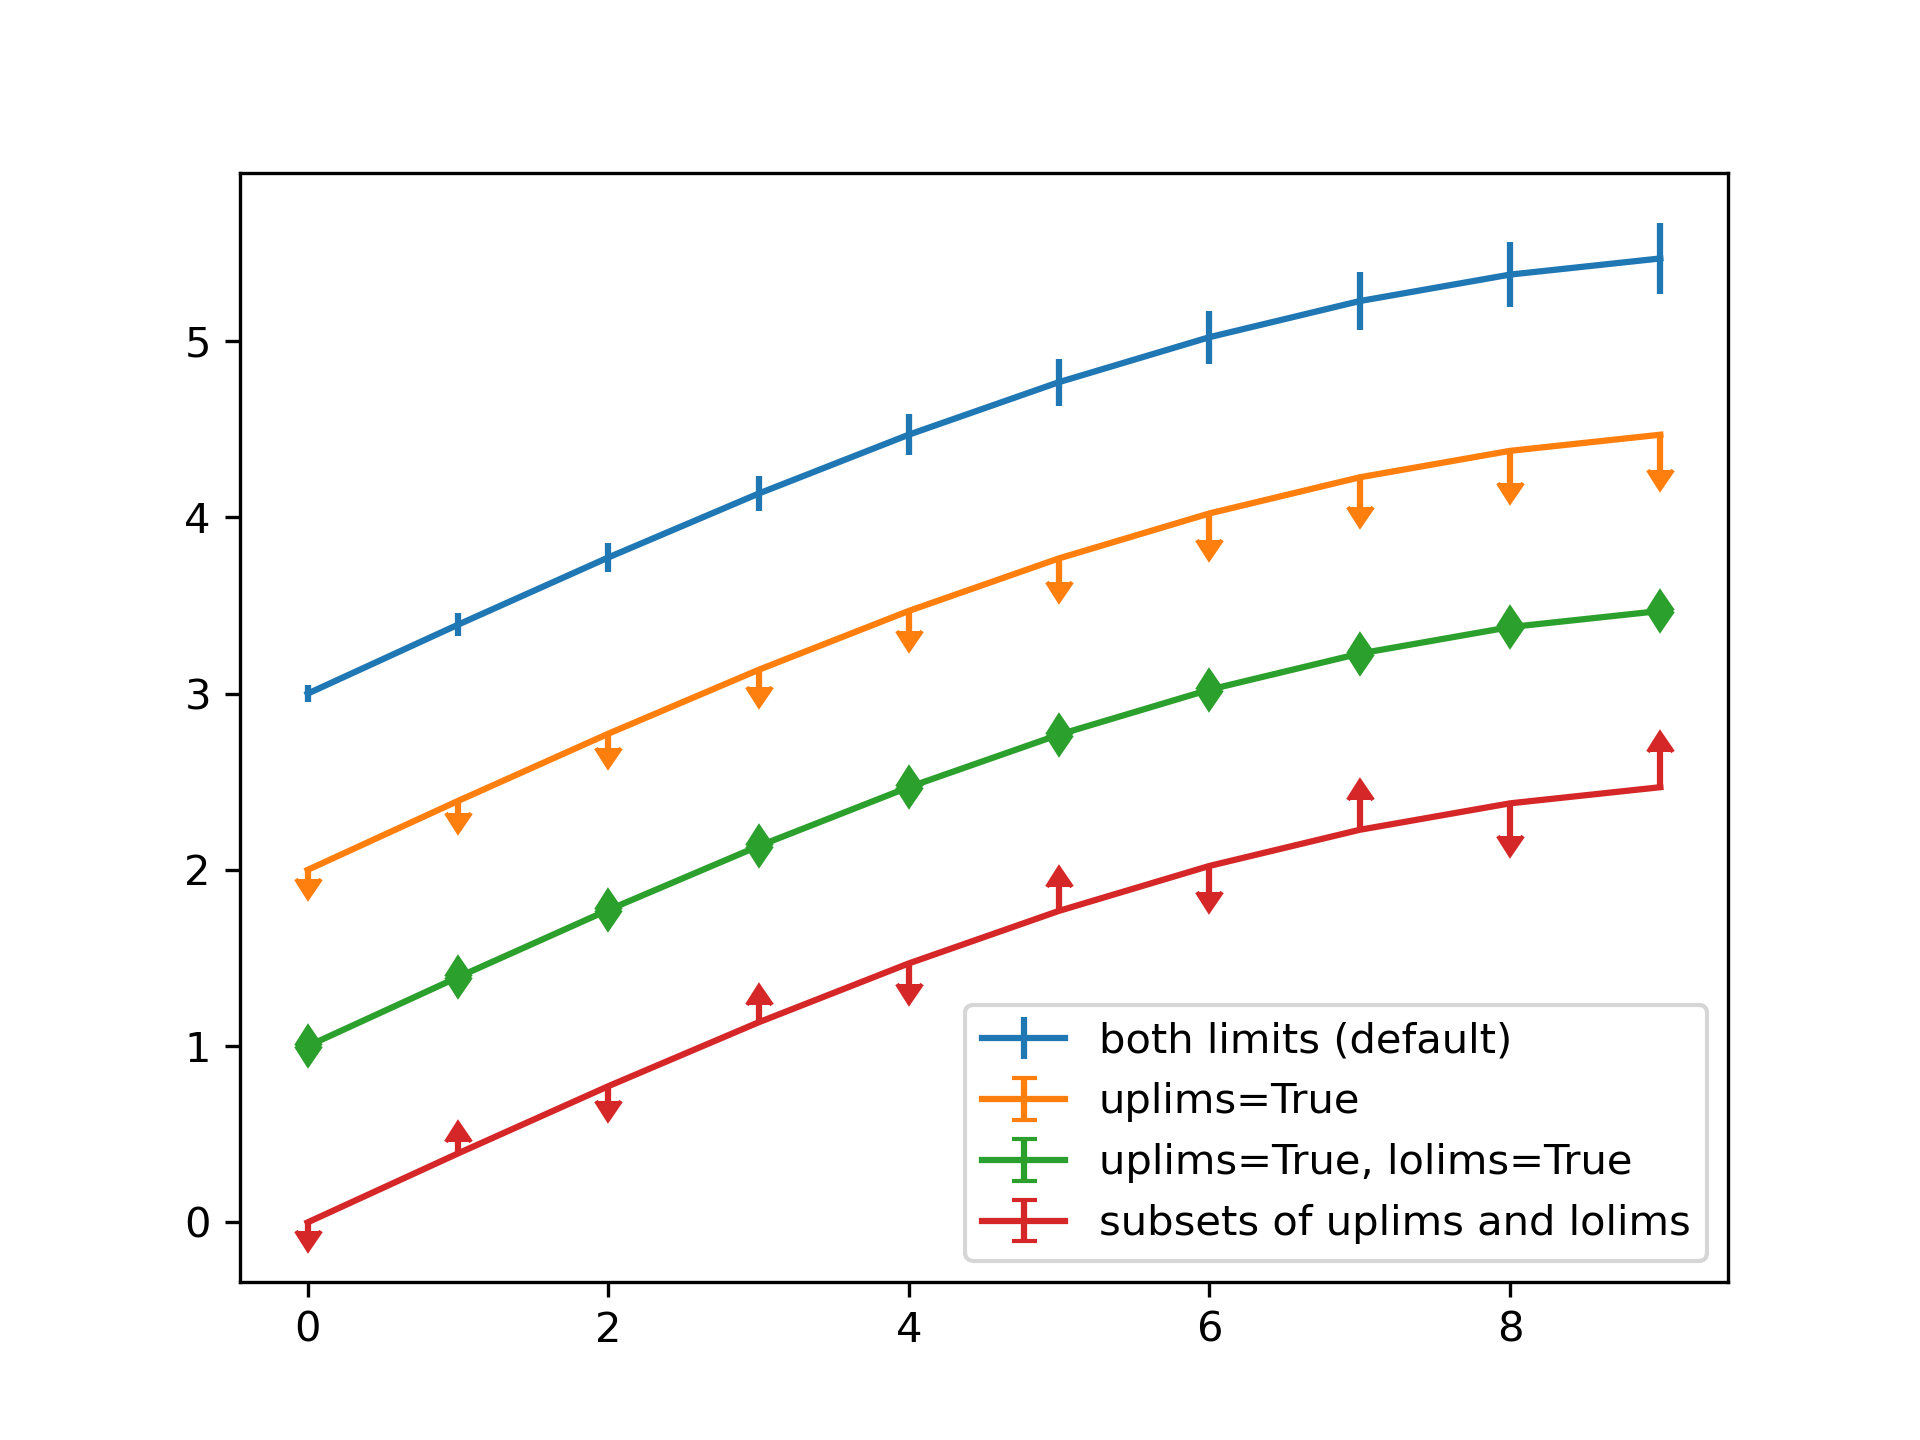
Illustration of selectively drawing lower and/or upper limit symbols on
errorbars using the parameters ``uplims``, ``lolims`` of `~.pyplot.errorbar`.
Alternatively, you can use 2xN values to draw errorbars in only one direction.
"""
...
... import numpy as np
... import matplotlib.pyplot as plt
...
...
... fig = plt.figure()
... x = np.arange(10)
... y = 2.5 * np.sin(x / 20 * np.pi)
... yerr = np.linspace(0.05, 0.2, 10)
...
... plt.errorbar(x, y + 3, yerr=yerr, label='both limits (default)')
...
... plt.errorbar(x, y + 2, yerr=yerr, uplims=True, label='uplims=True')
...
... plt.errorbar(x, y + 1, yerr=yerr, uplims=True, lolims=True,
... label='uplims=True, lolims=True')
...
... upperlimits = [True, False] * 5
... lowerlimits = [False, True] * 5
... plt.errorbar(x, y, yerr=yerr, uplims=upperlimits, lolims=lowerlimits,
... label='subsets of uplims and lolims')
...
... plt.legend(loc='lower right')
...
...
... ##############################################################################
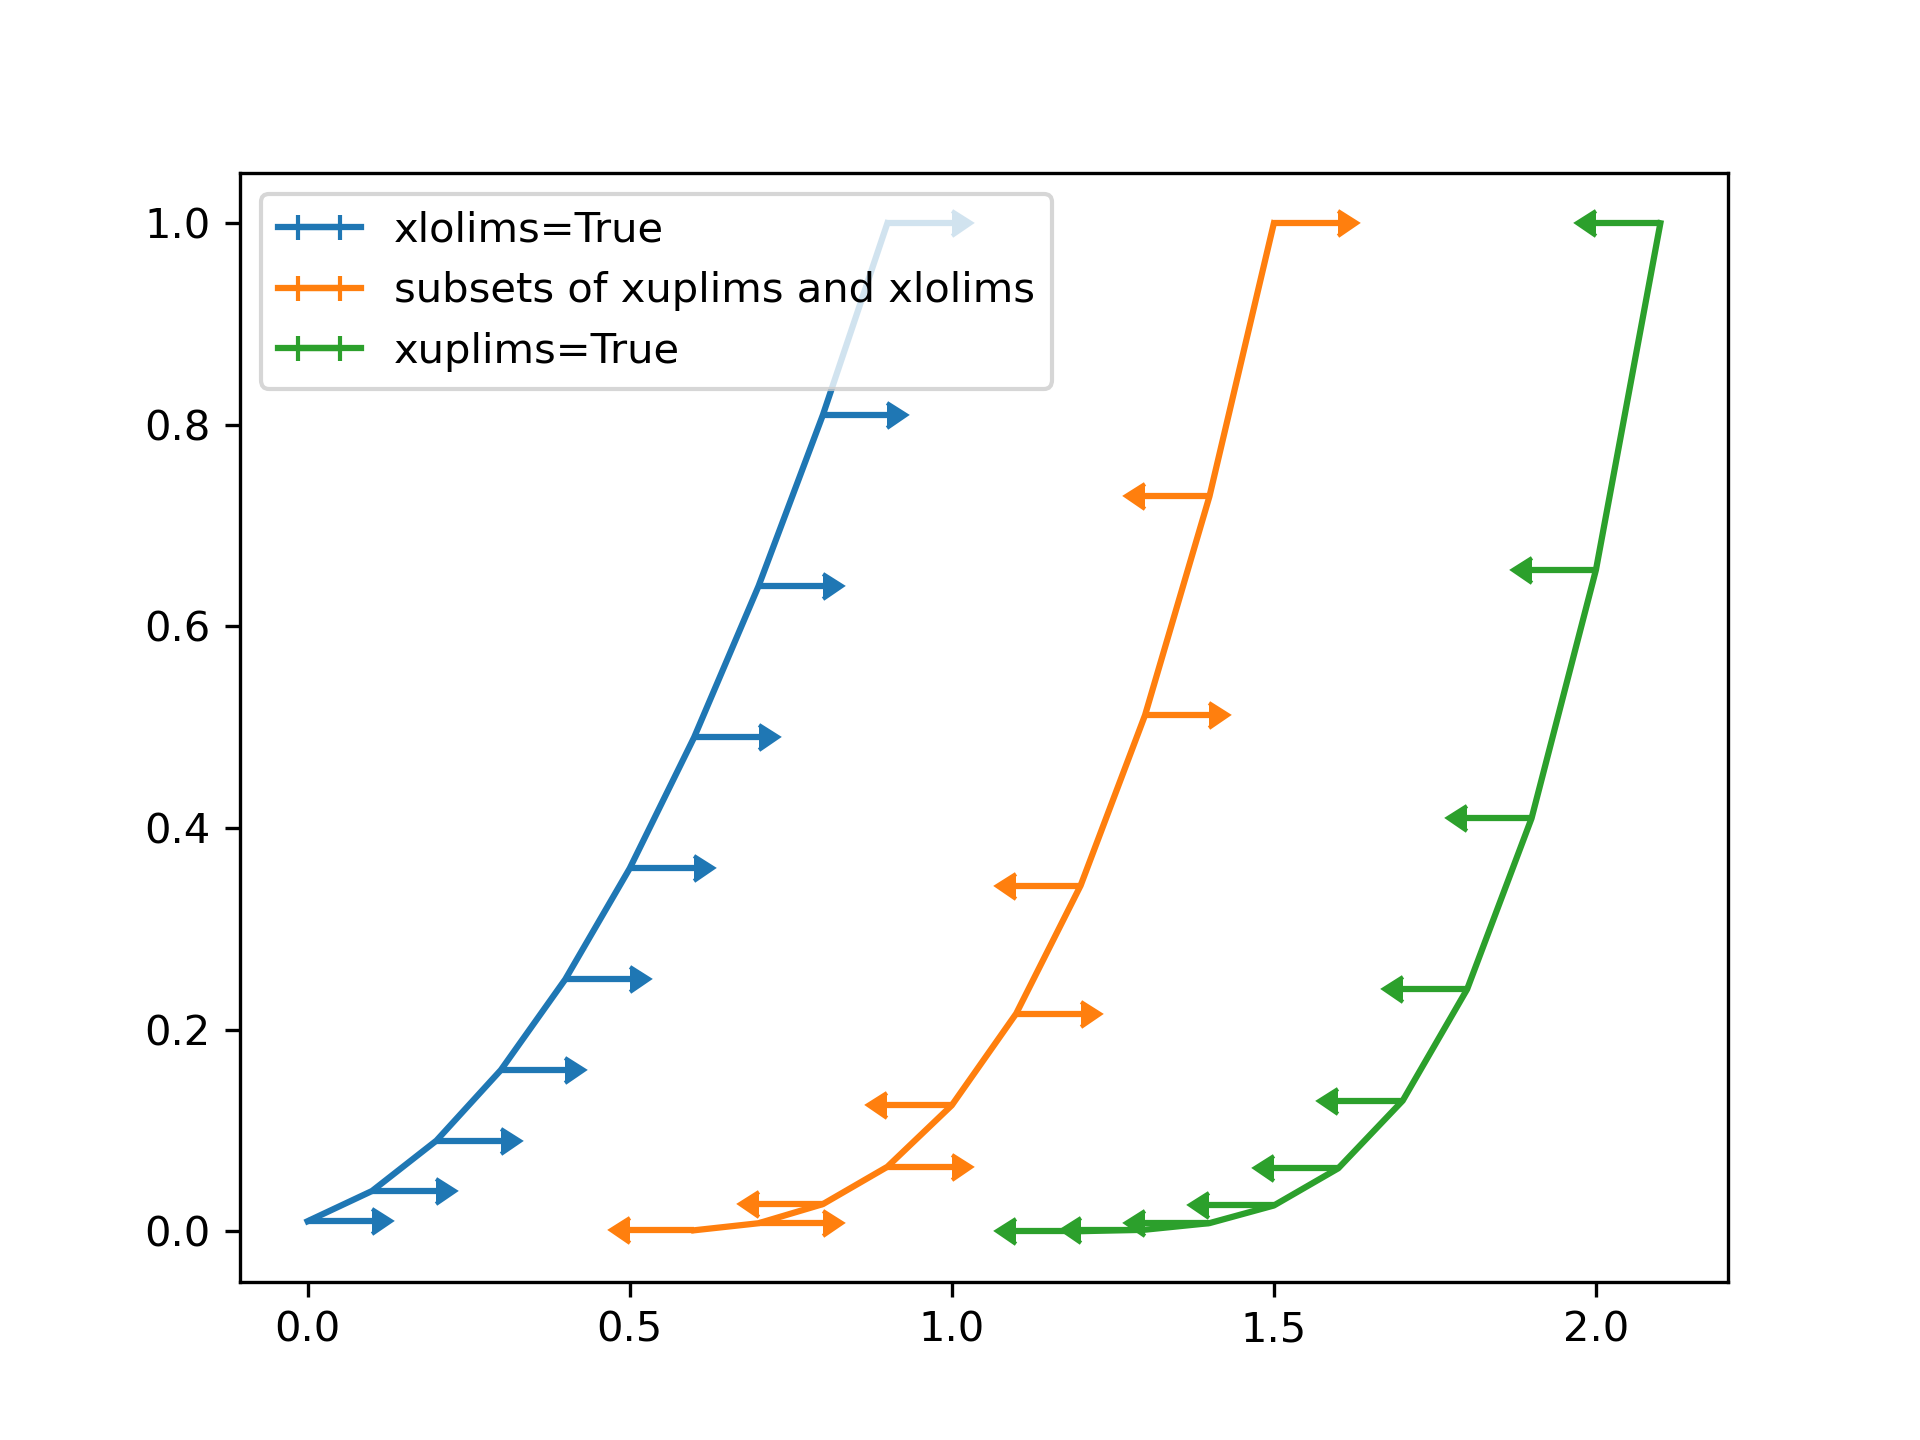
... # Similarly ``xuplims`` and ``xlolims`` can be used on the horizontal ``xerr``
... # errorbars.
...
... fig = plt.figure()
... x = np.arange(10) / 10
... y = (x + 0.1)**2
...
... plt.errorbar(x, y, xerr=0.1, xlolims=True, label='xlolims=True')
... y = (x + 0.1)**3
...
... plt.errorbar(x + 0.6, y, xerr=0.1, xuplims=upperlimits, xlolims=lowerlimits,
... label='subsets of xuplims and xlolims')
...
... y = (x + 0.1)**4
... plt.errorbar(x + 1.2, y, xerr=0.1, xuplims=True, label='xuplims=True')
...
... plt.legend()
... plt.show()
...
... ##############################################################################
... #
... # .. admonition:: References
... #
... # The use of the following functions, methods, classes and modules is shown
... # in this example:
... #
... # - `matplotlib.axes.Axes.errorbar` / `matplotlib.pyplot.errorbar`
...